





AI Copilot
23.6×
NVIDIA's trailing P/E
$188.48 divided by $7.97 of earnings over the last twelve months, each figure tied to its source.
As of Nov 5, 2026See how

Research US stocks and crypto with an AI Copilot that shows the figures behind its answers. Check fundamentals and technicals, screen for ideas, and test them with paper trading before real money is involved.
Free plan, no card required.
New: AI Quant
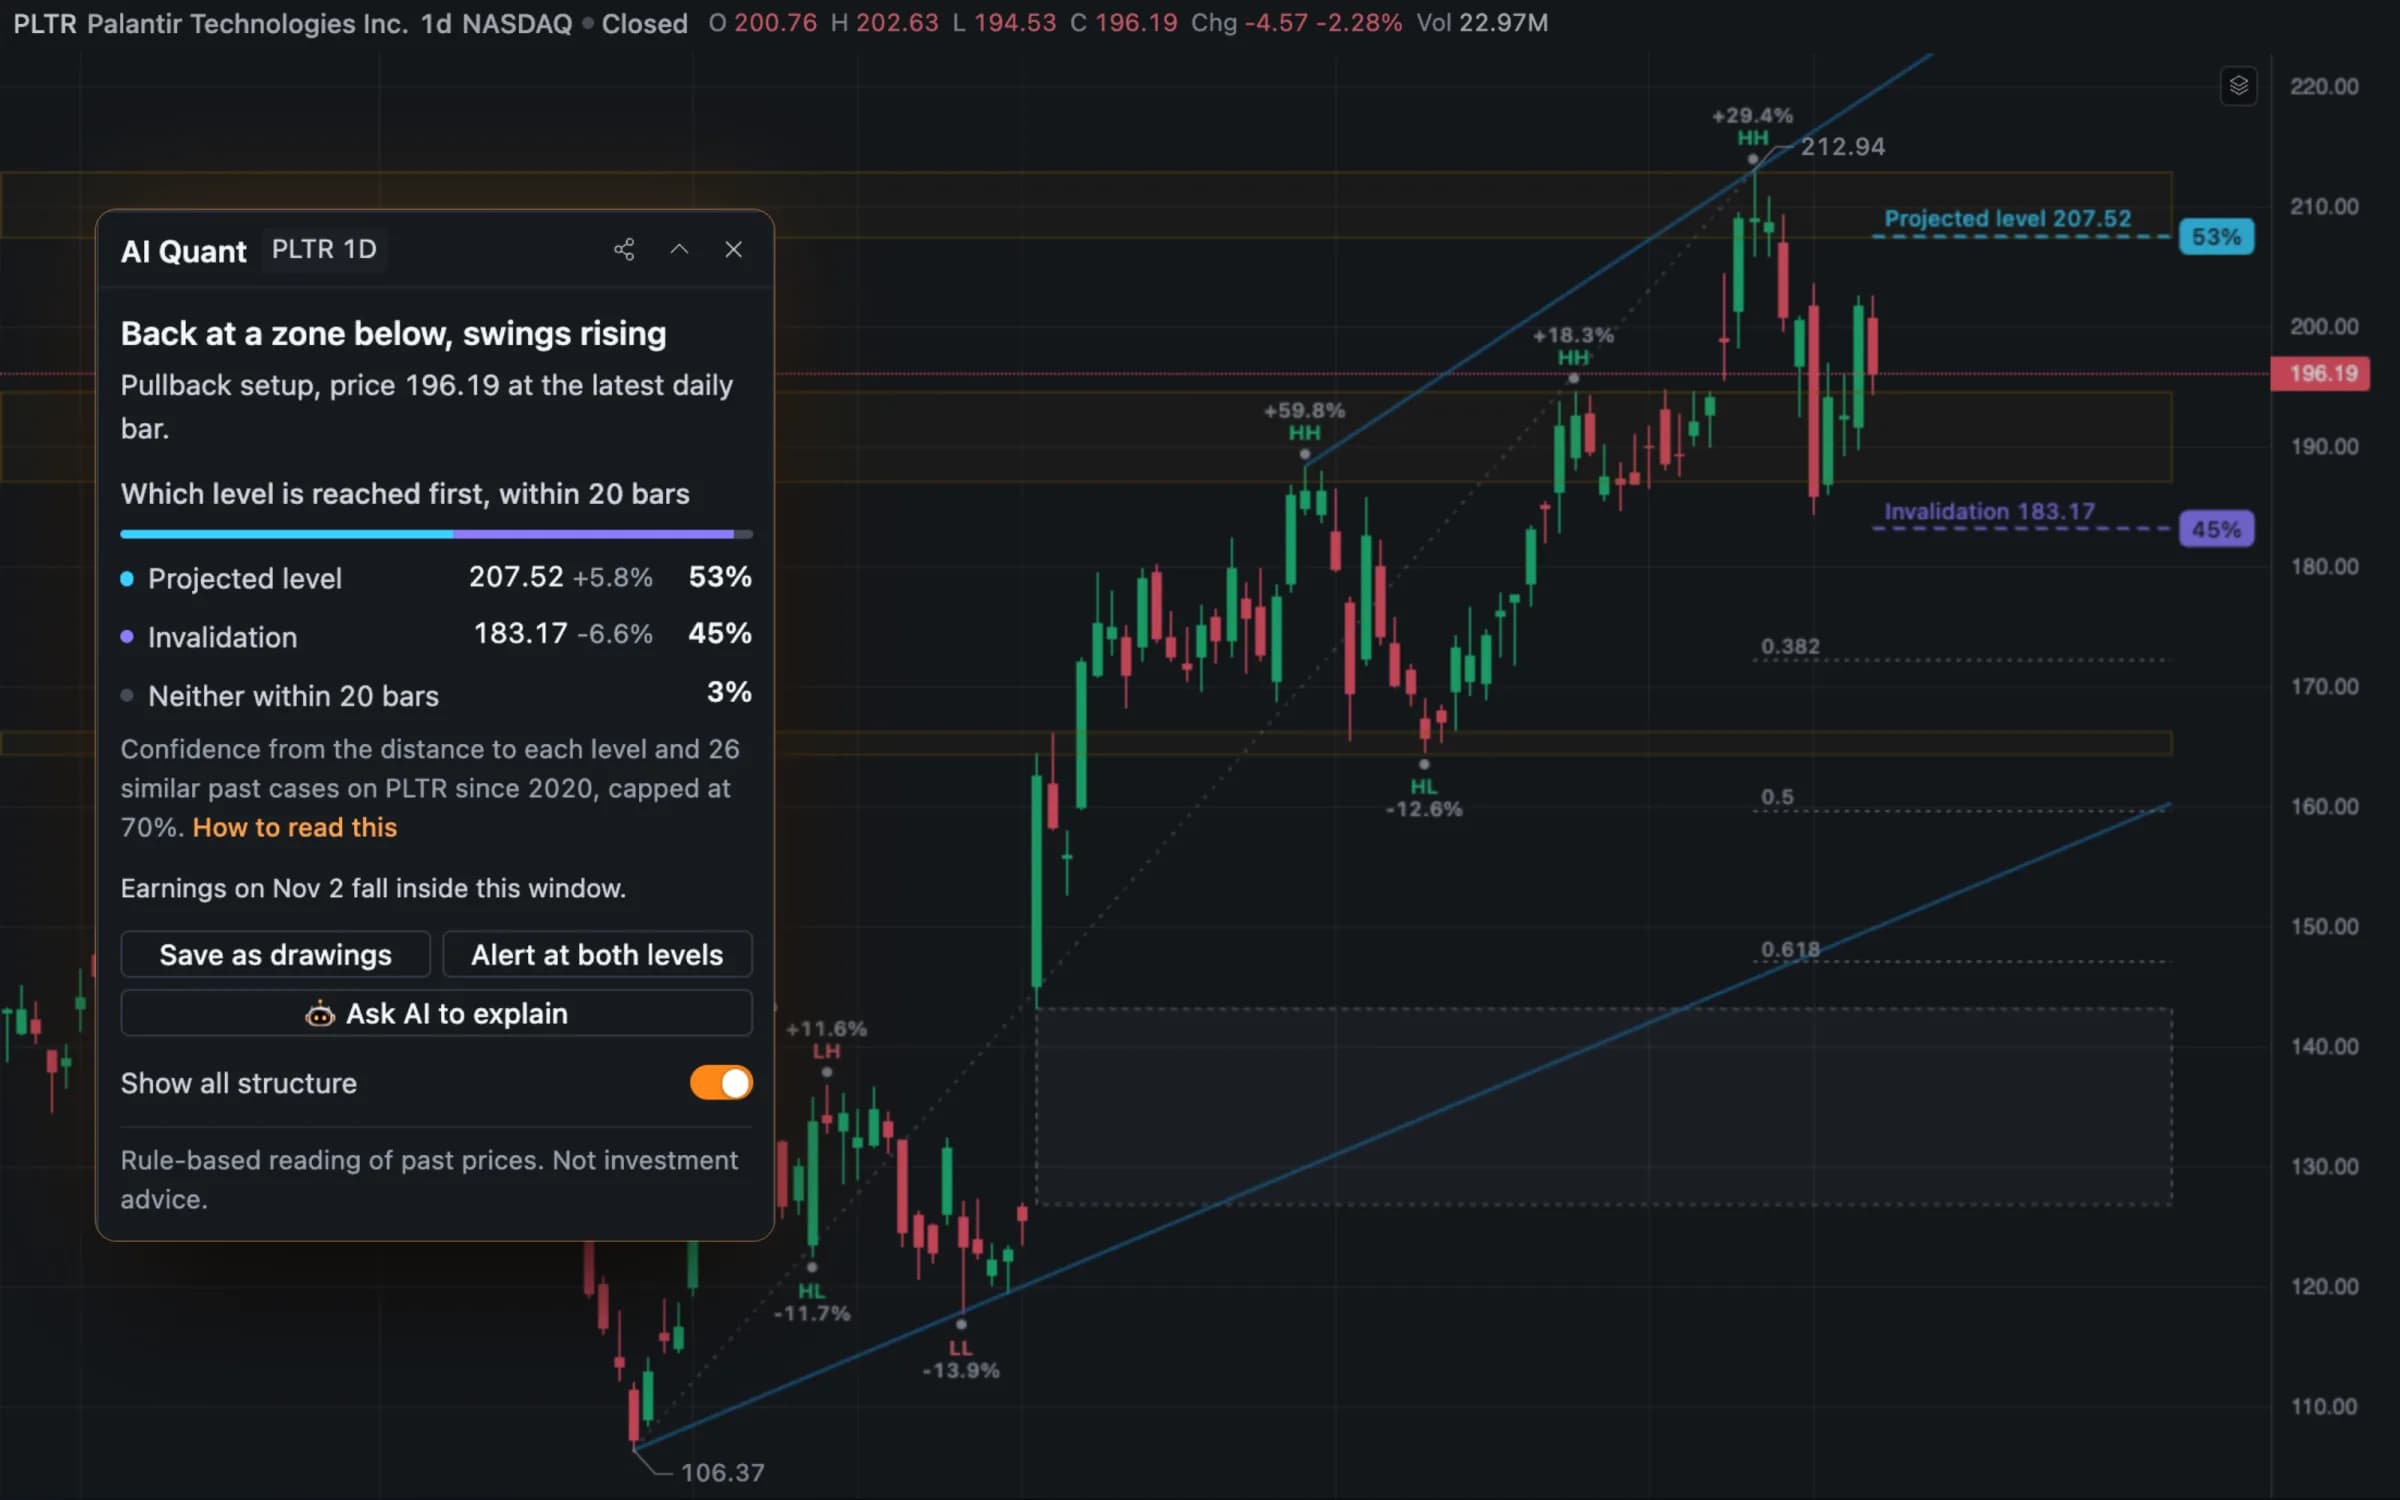
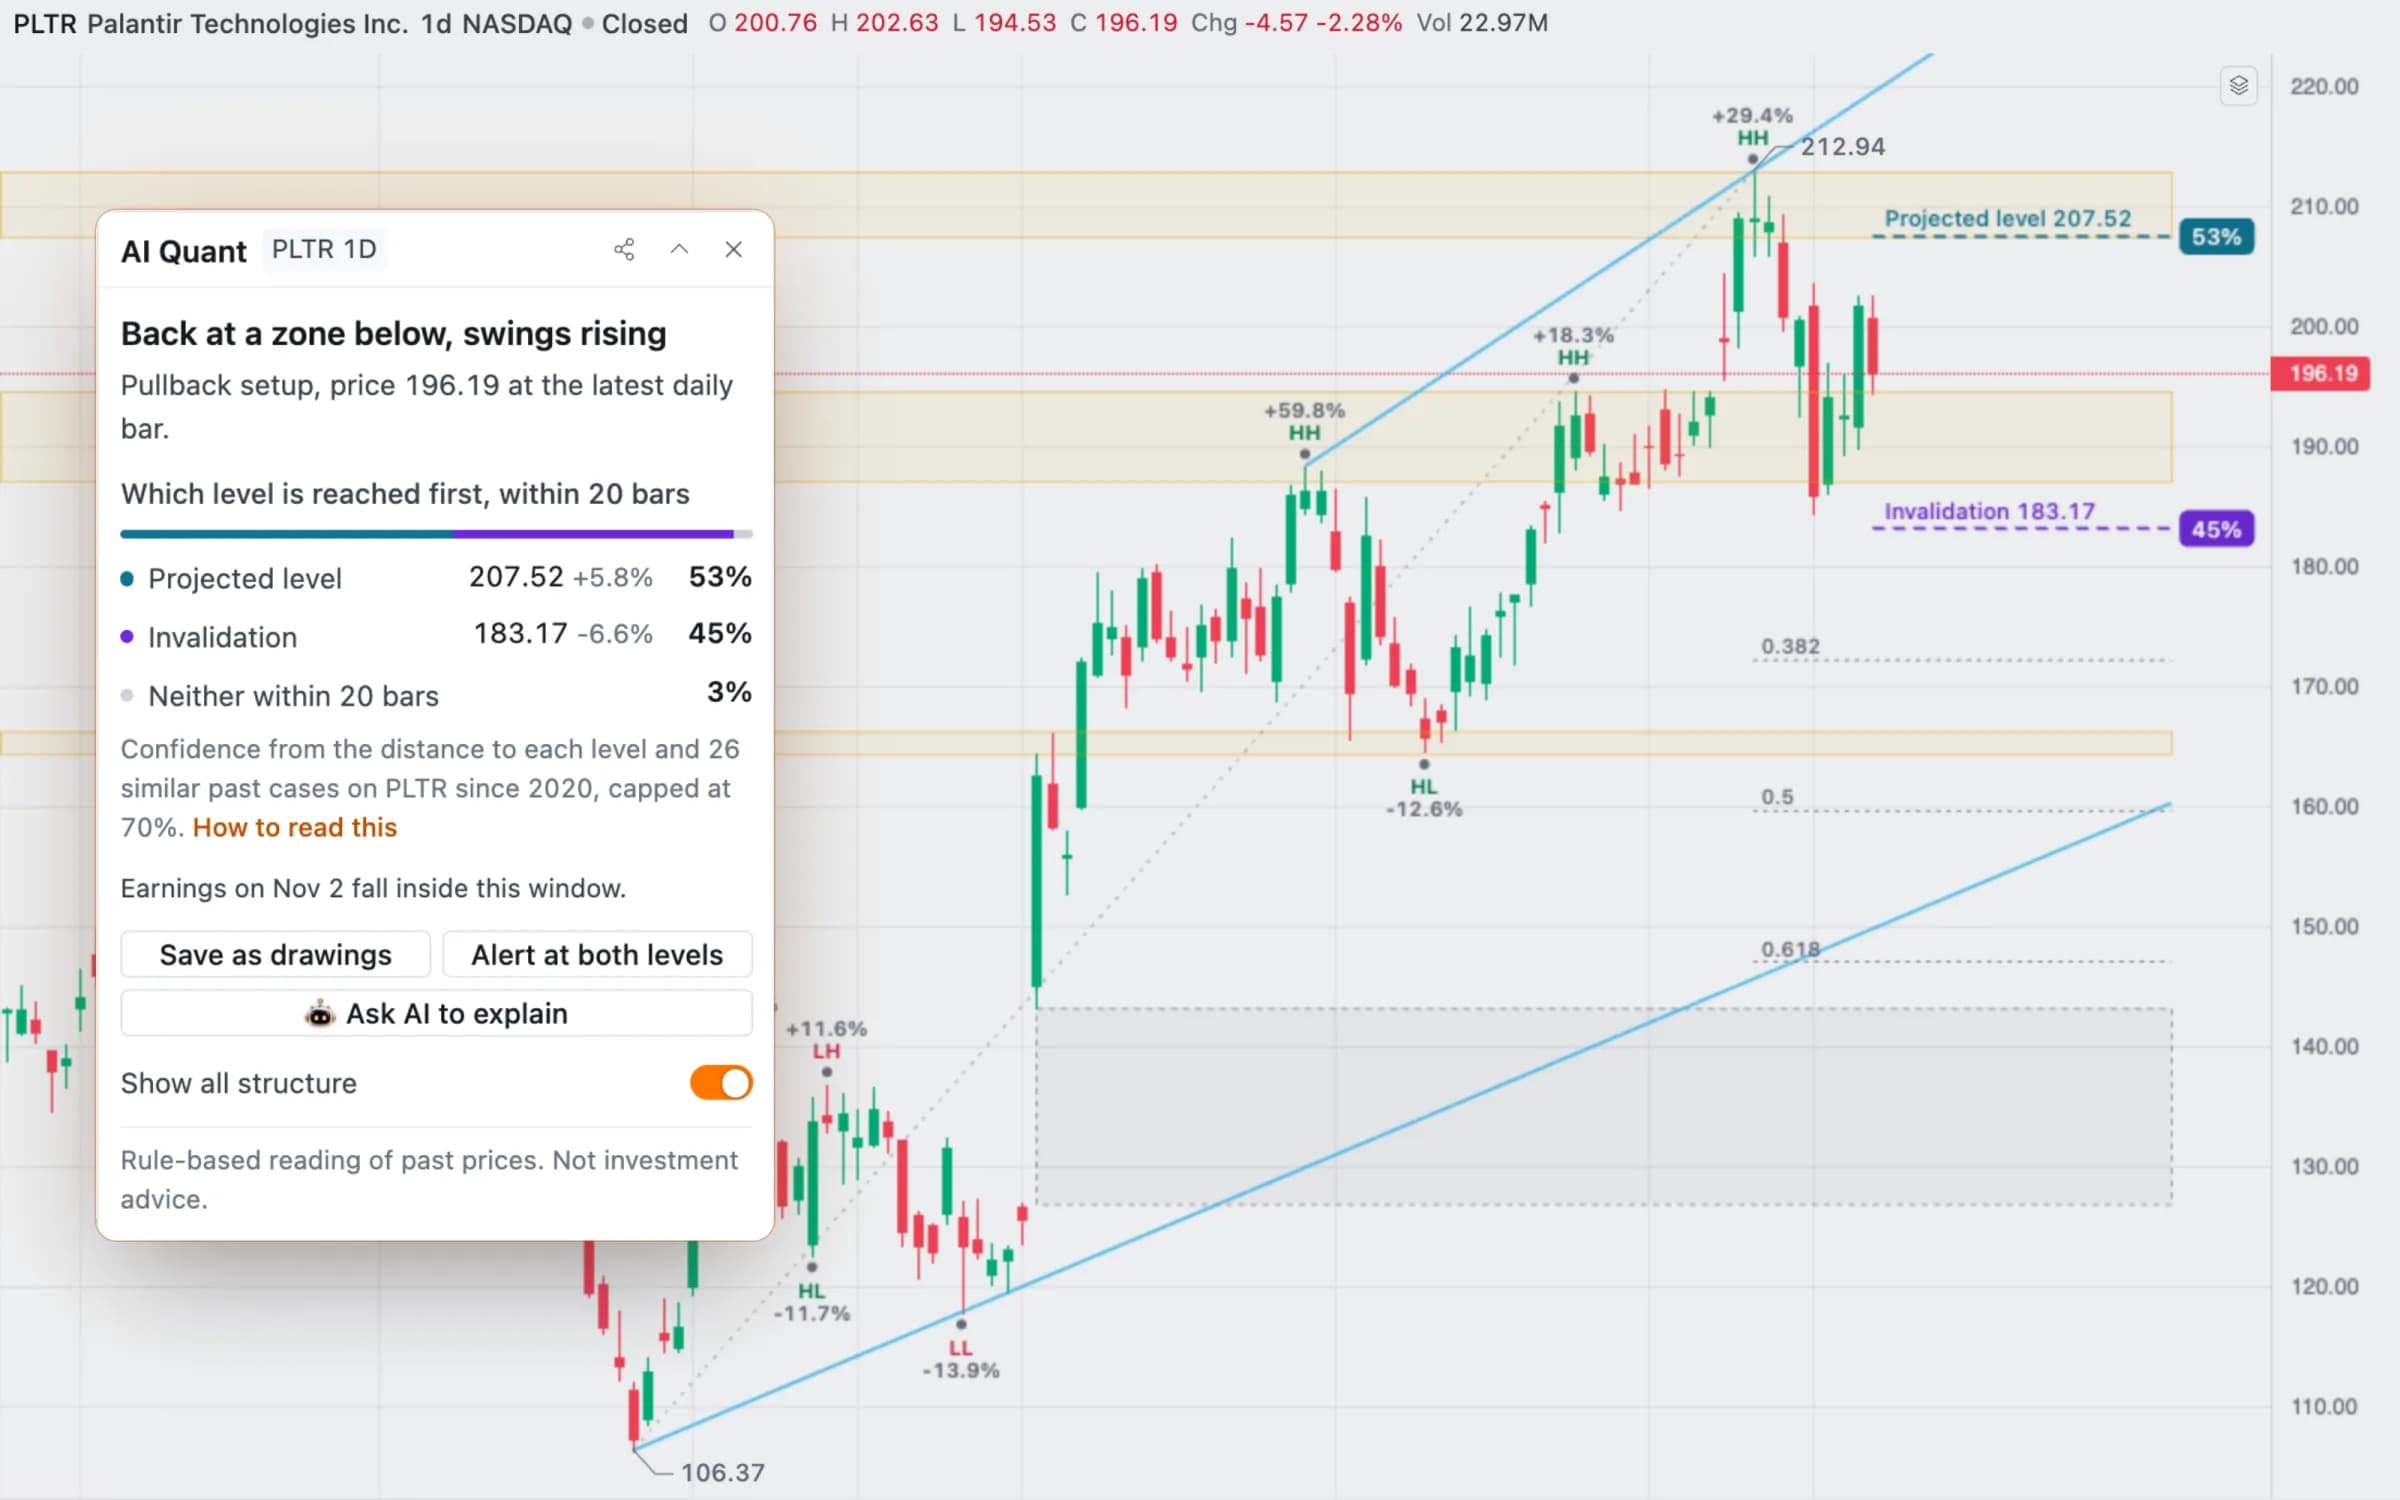
Press one button on any US stock chart. AI Quant marks the trend, the support and resistance zones and the chart patterns, then sets out the scenario from here and the level that would cancel it.
Drawn on your chart
Swings, zones, trendlines and Fibonacci levels, measured from the price bars rather than guessed.
Both sides of the scenario
The level the setup points to, the level that cancels it, and which one came first more often in that stock's own history.
Ask, alert, save
Ask follow-up questions in plain language, set price alerts at both levels, or keep the drawing on your chart.
Educational analysis from price history. Not investment advice.
Start with free lessons in plain language, look up any term in the glossary, then practise with virtual money before you use real money.
US stocks, crypto and every sector, from the same data the app runs on. Spot a move here, then open the chart or ask the AI why it happened.
| Name | Price | 1D change |
|---|---|---|
 FROGJFrog Ltd. | $98.32 | +31.76% |
 KRMNKarman Holdings Inc. | $39.37 | +22.69% |
 LASRnLIGHT, Inc. | $35.98 | +22.63% |
 TMDXTransMedics Group, Inc. | $81.96 | +18.82% |
 FLYFirefly Aerospace Inc. | $18.01 | +18.68% |
 IRENIREN Limited | $20.98 | +16.36% |
 OKLOOklo Inc. | $22.21 | +15.68% |
 EXTRExtreme Networks, Inc. | $24.27 | +15.30% |
Companies over $2B market cap. Most active is ranked by dollar volume.
The 200 largest US stocks, grouped by sector. A bigger tile is a bigger company; a greener tile is up more today.
Eleven US sectors ranked by return. Pick a period, then open a sector to see its largest holdings.
over the last session
XLK$165.79
Return by period
Largest holdings, share of the fundToday
Quotes can be delayed and refresh about every 10 minutes. For information only, not investment advice.
The product follows the way research actually happens, from the first idea to the review afterwards.
01
Scan the market and screen for candidates.
02
Read the chart, the numbers and the company.
03
Ask the AI Copilot and check its sources.
04
Try the idea with virtual funds.
05
Track what you hold and how it performed.
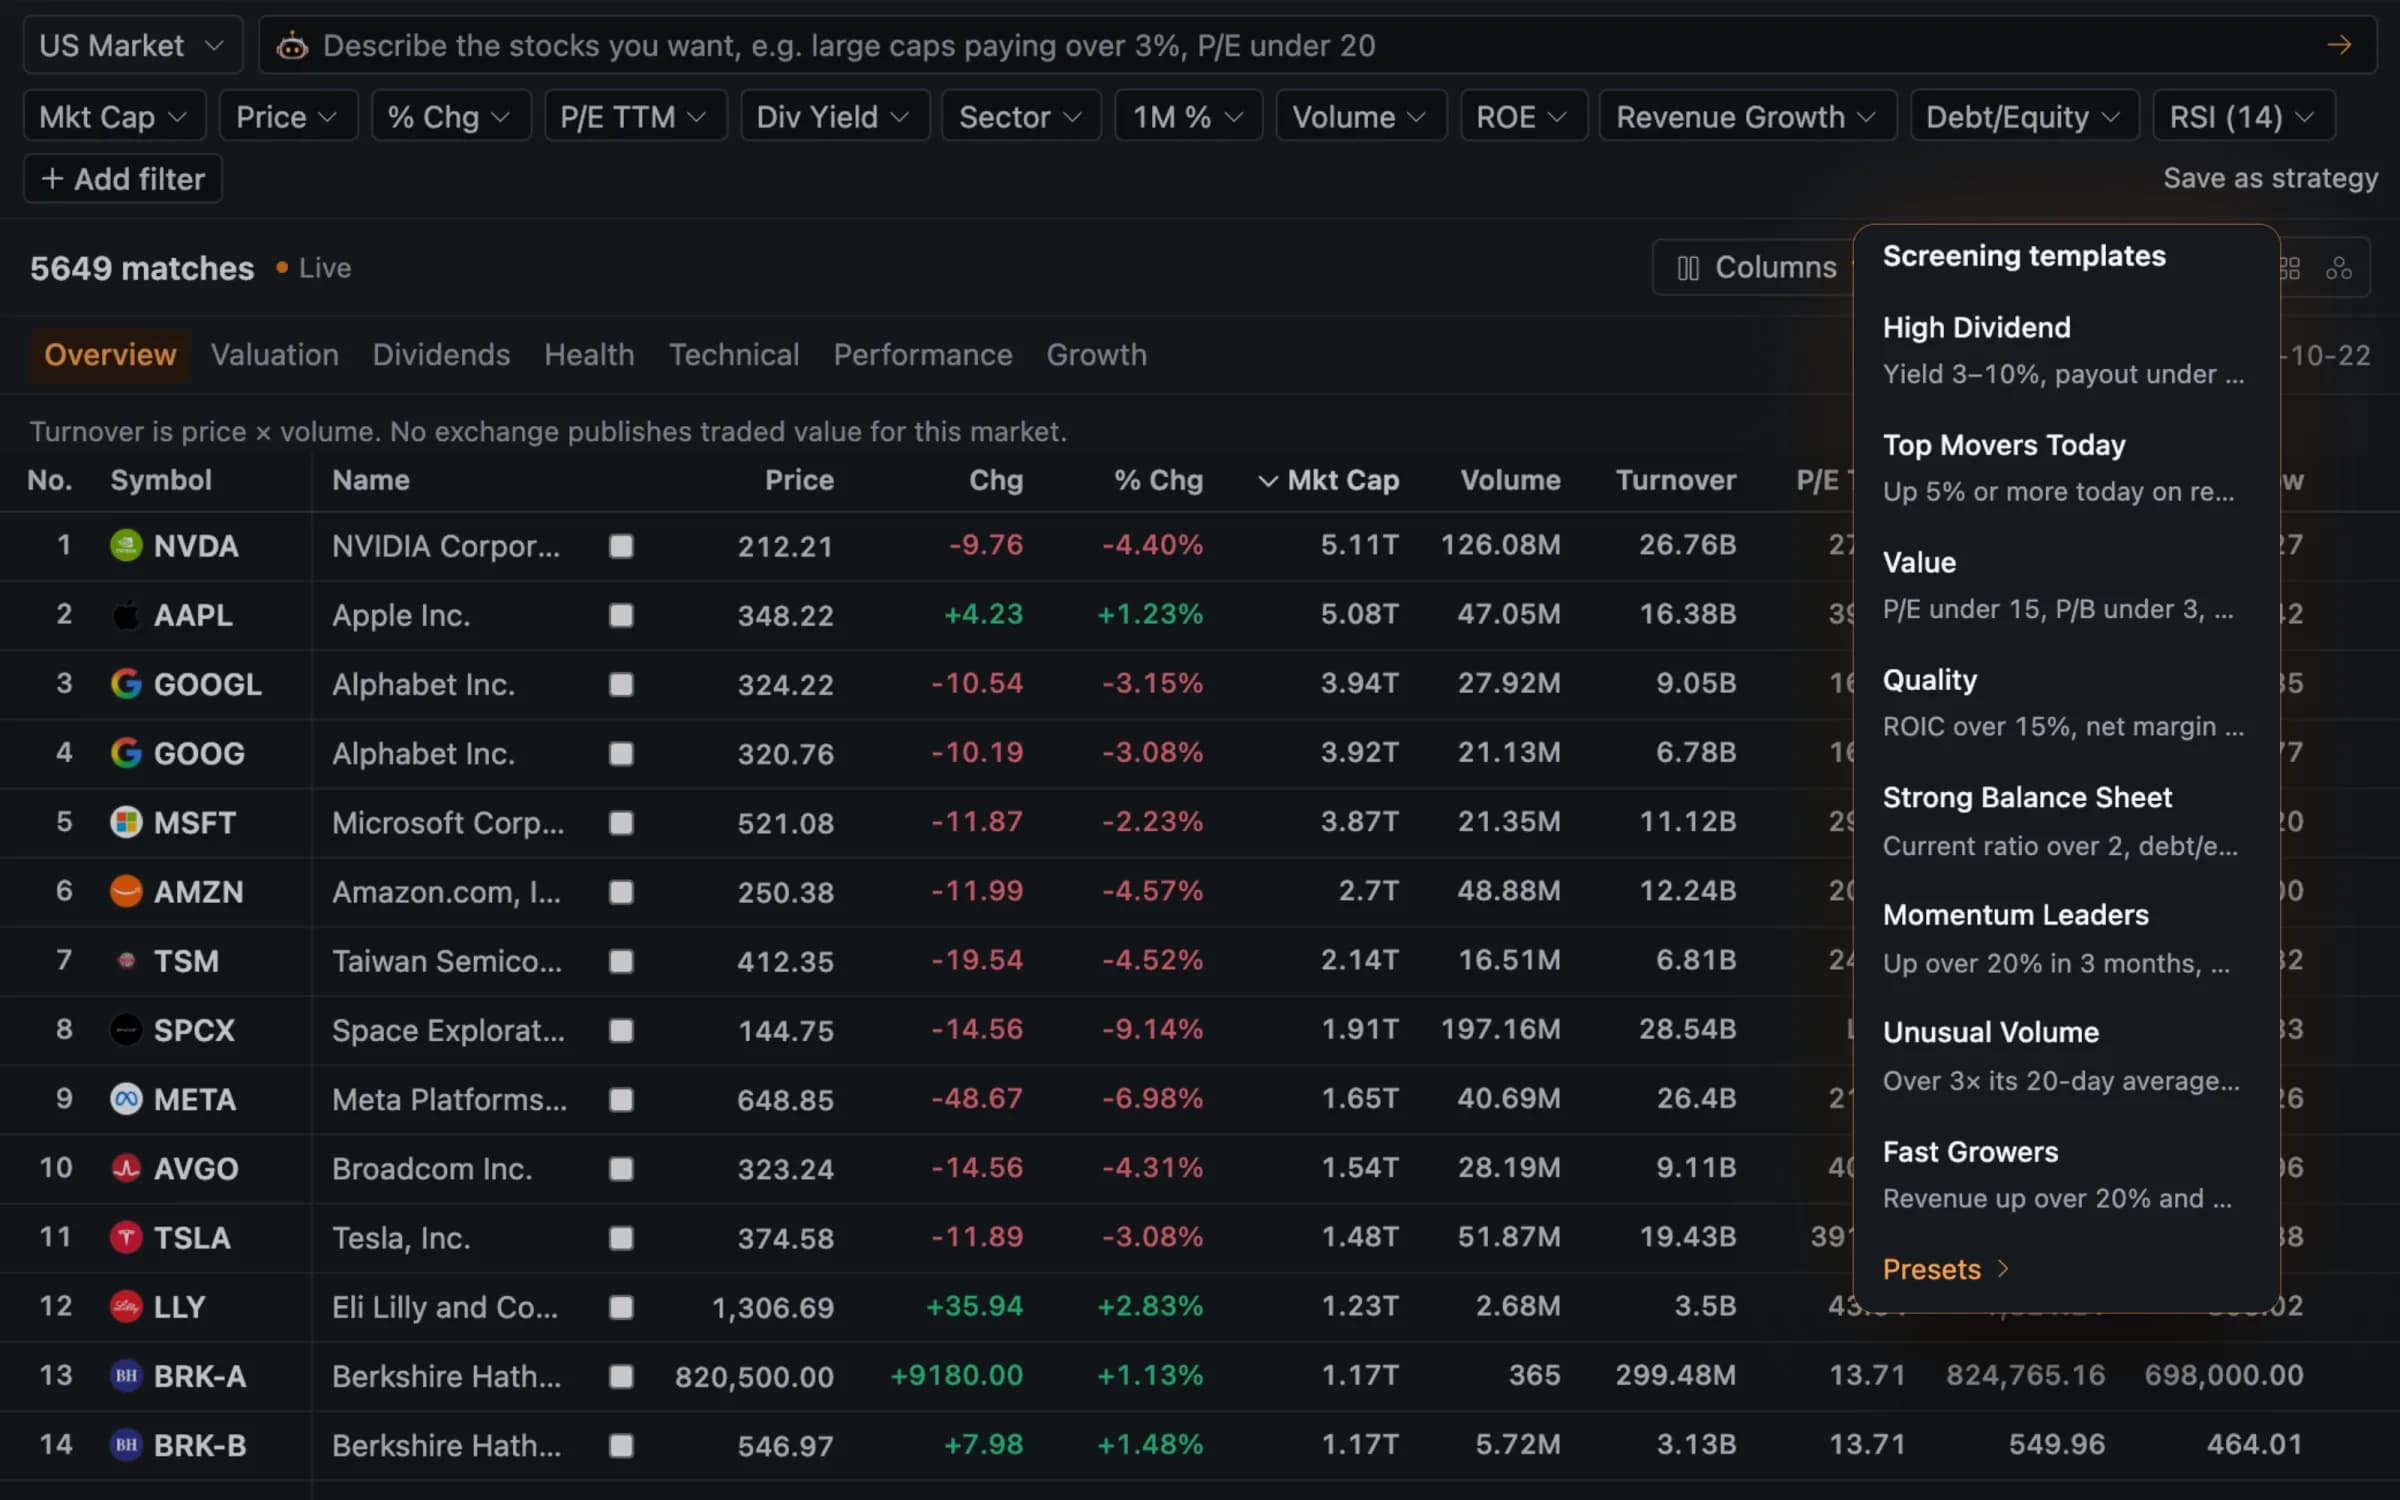
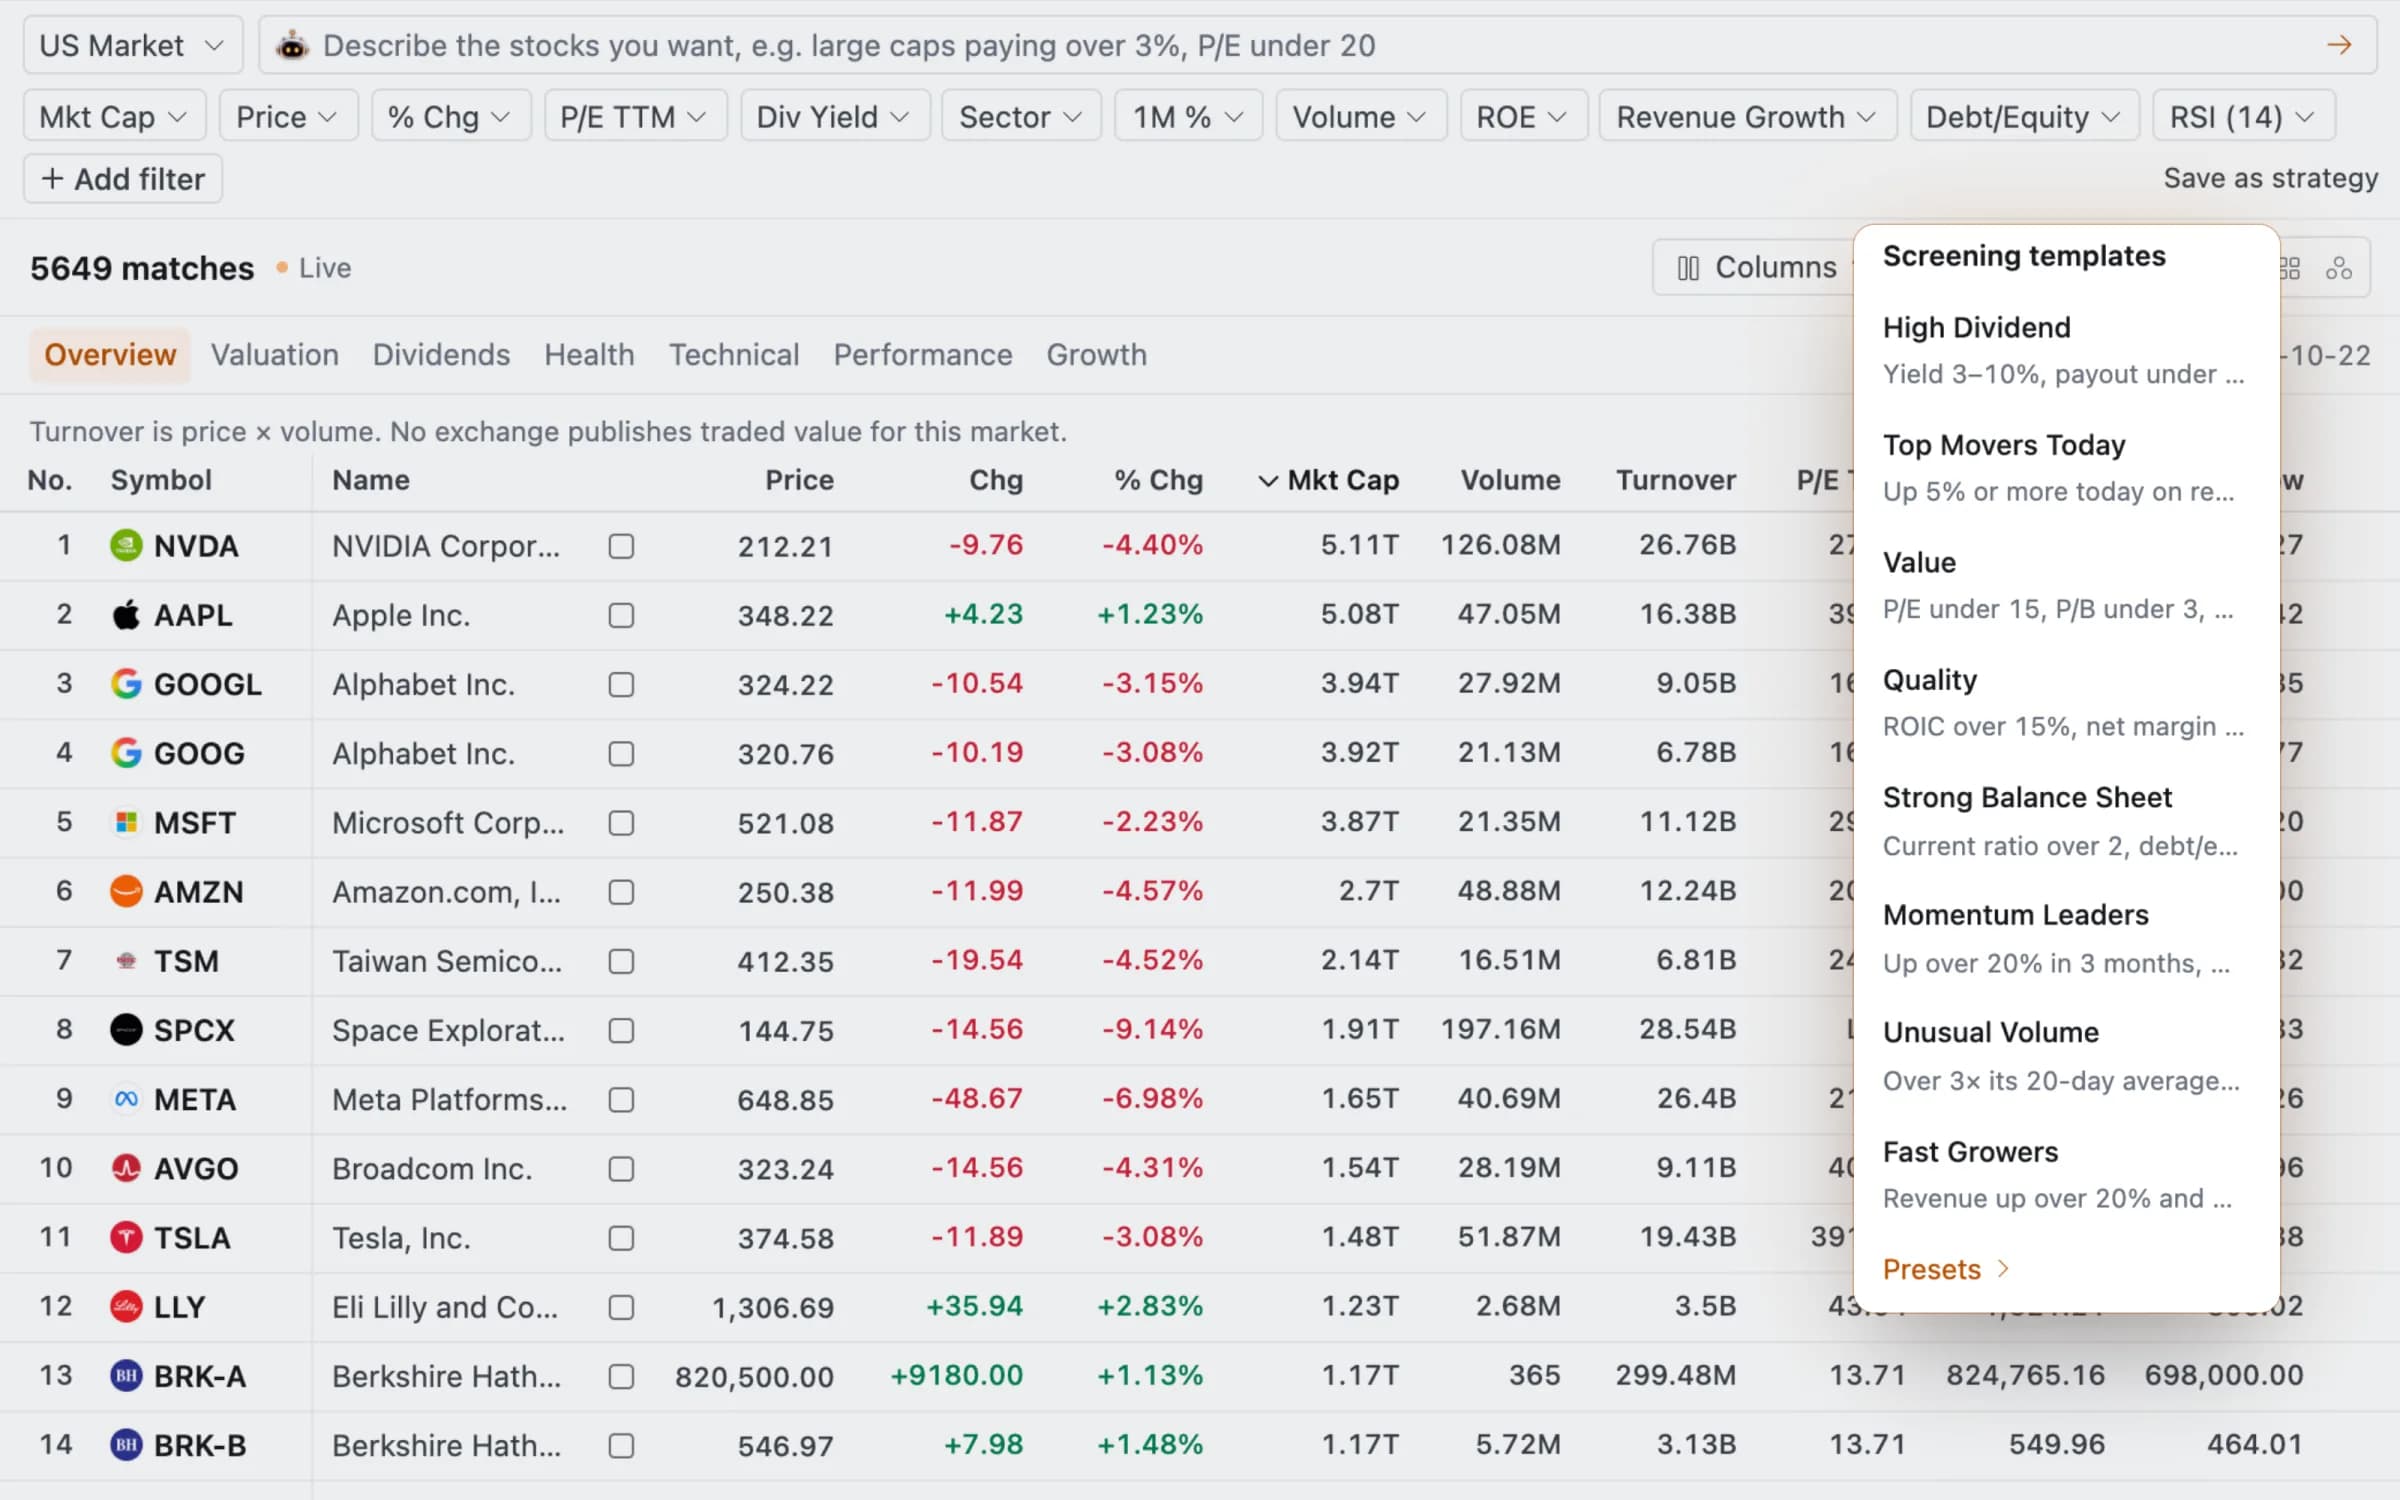
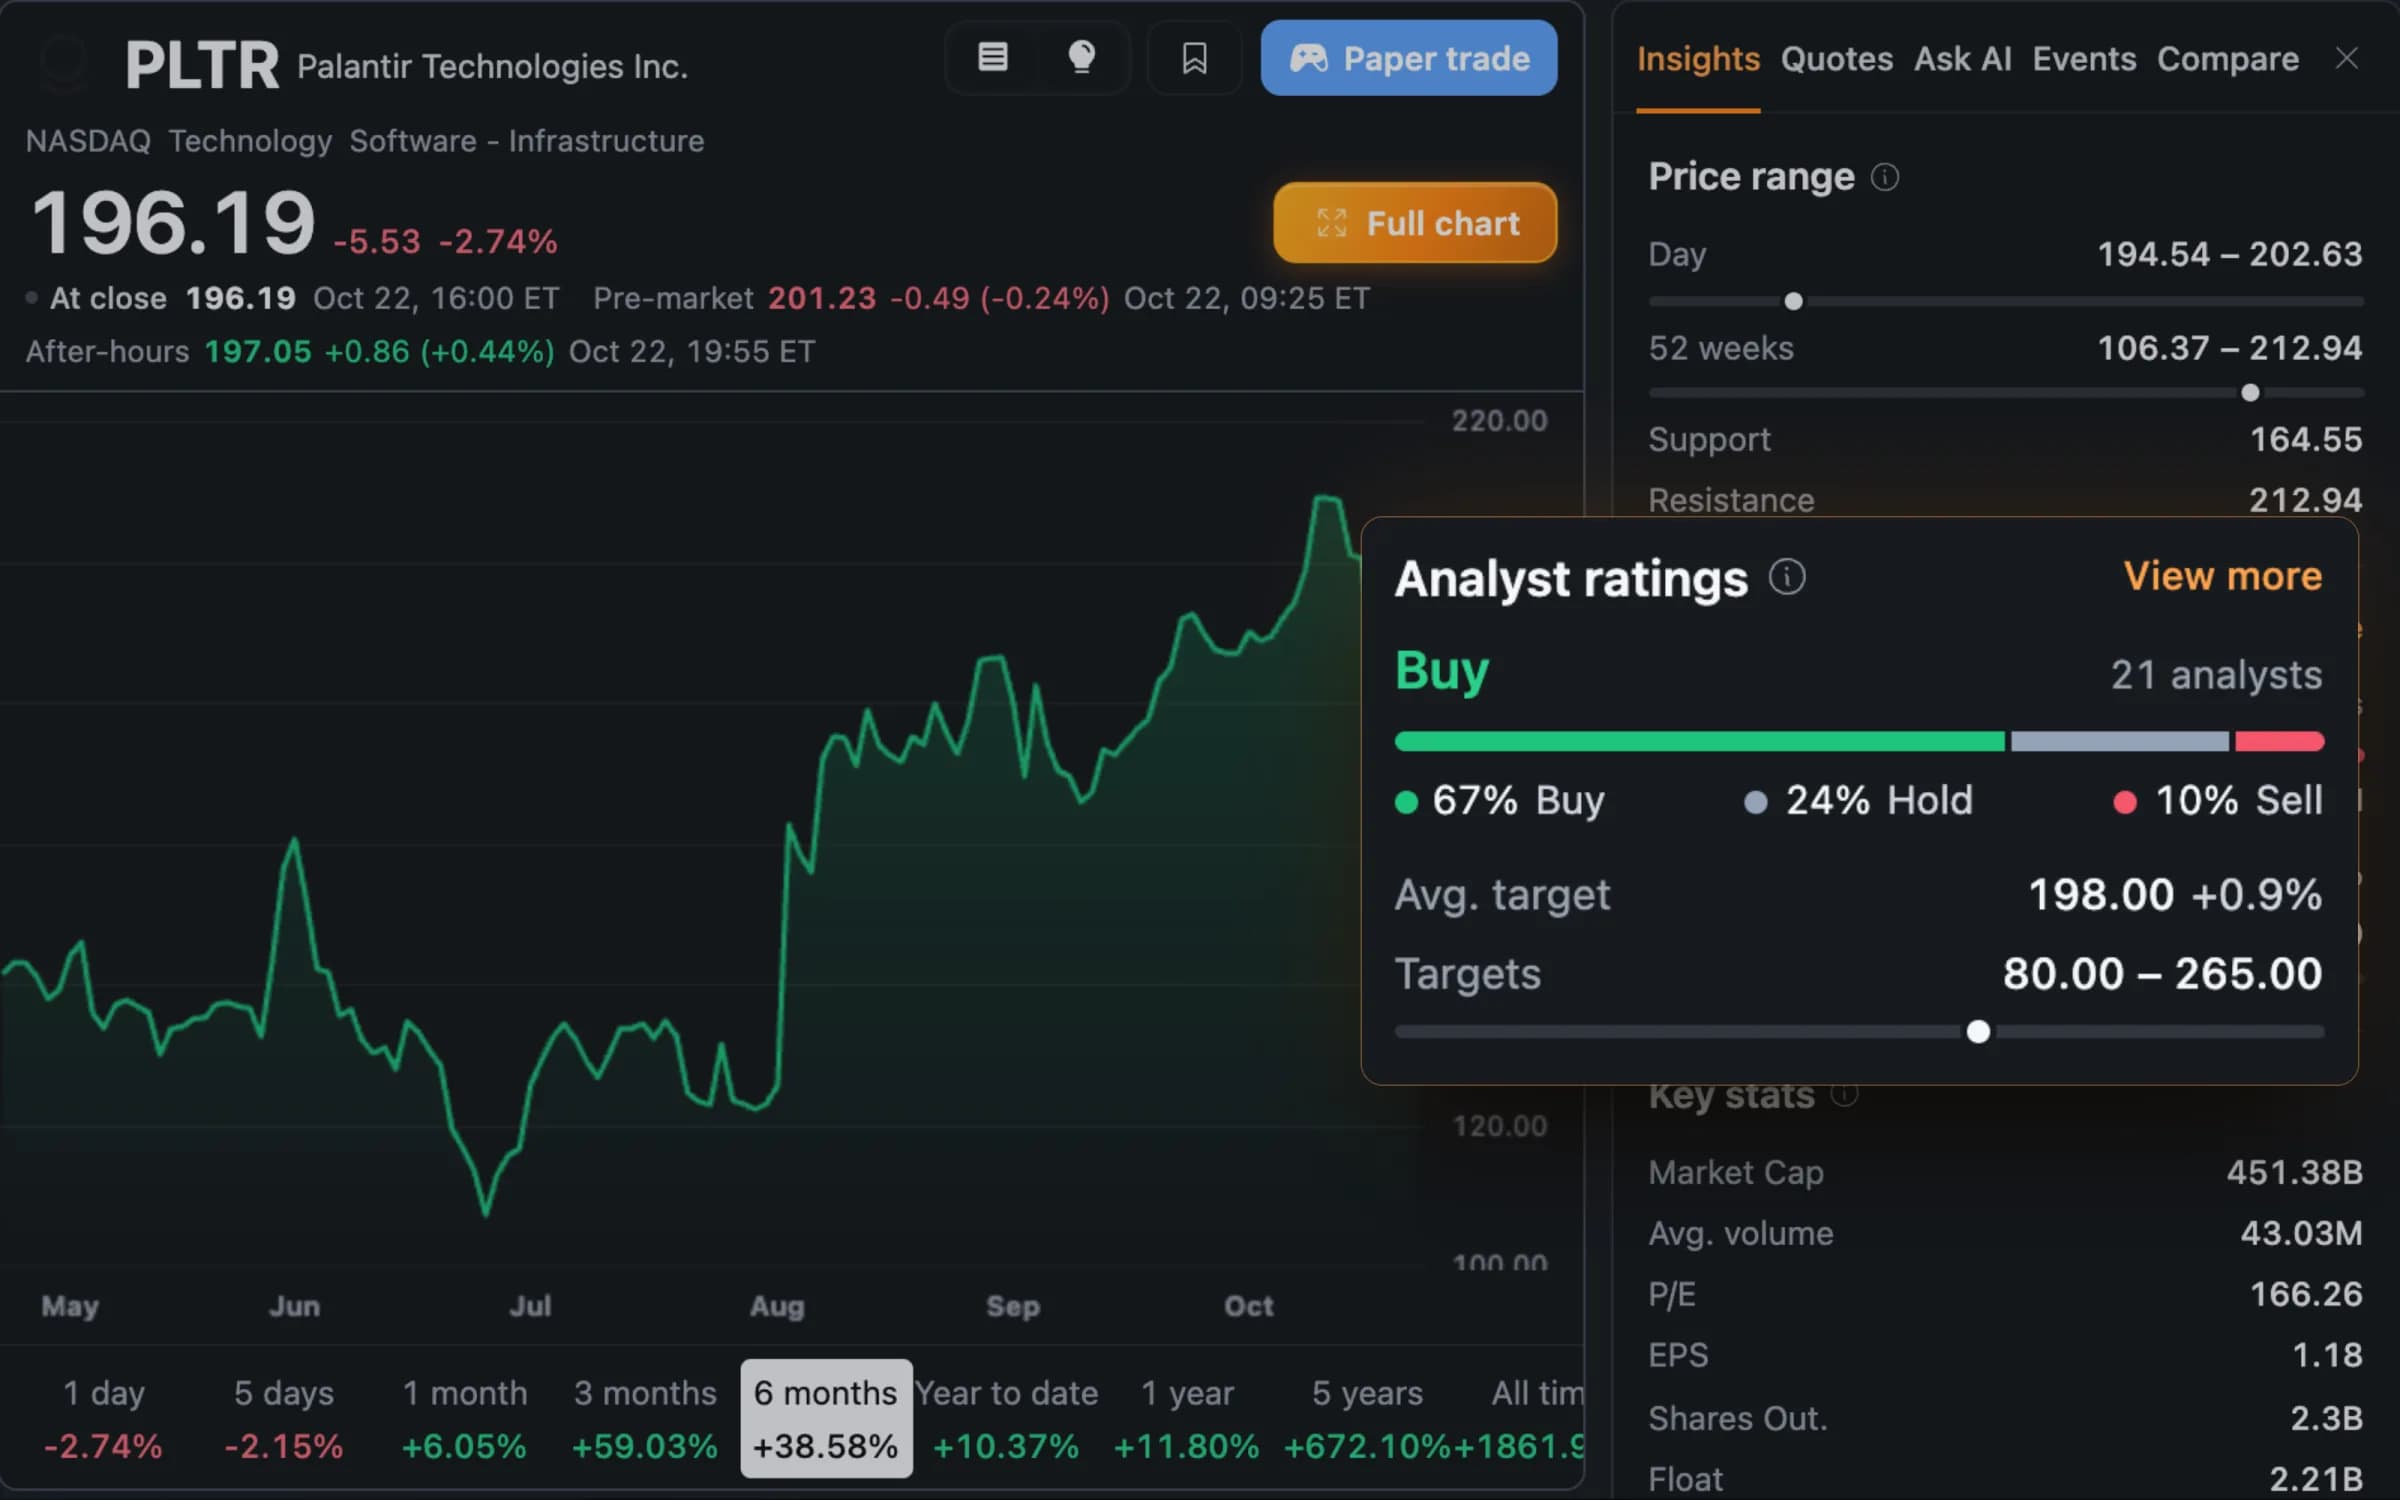
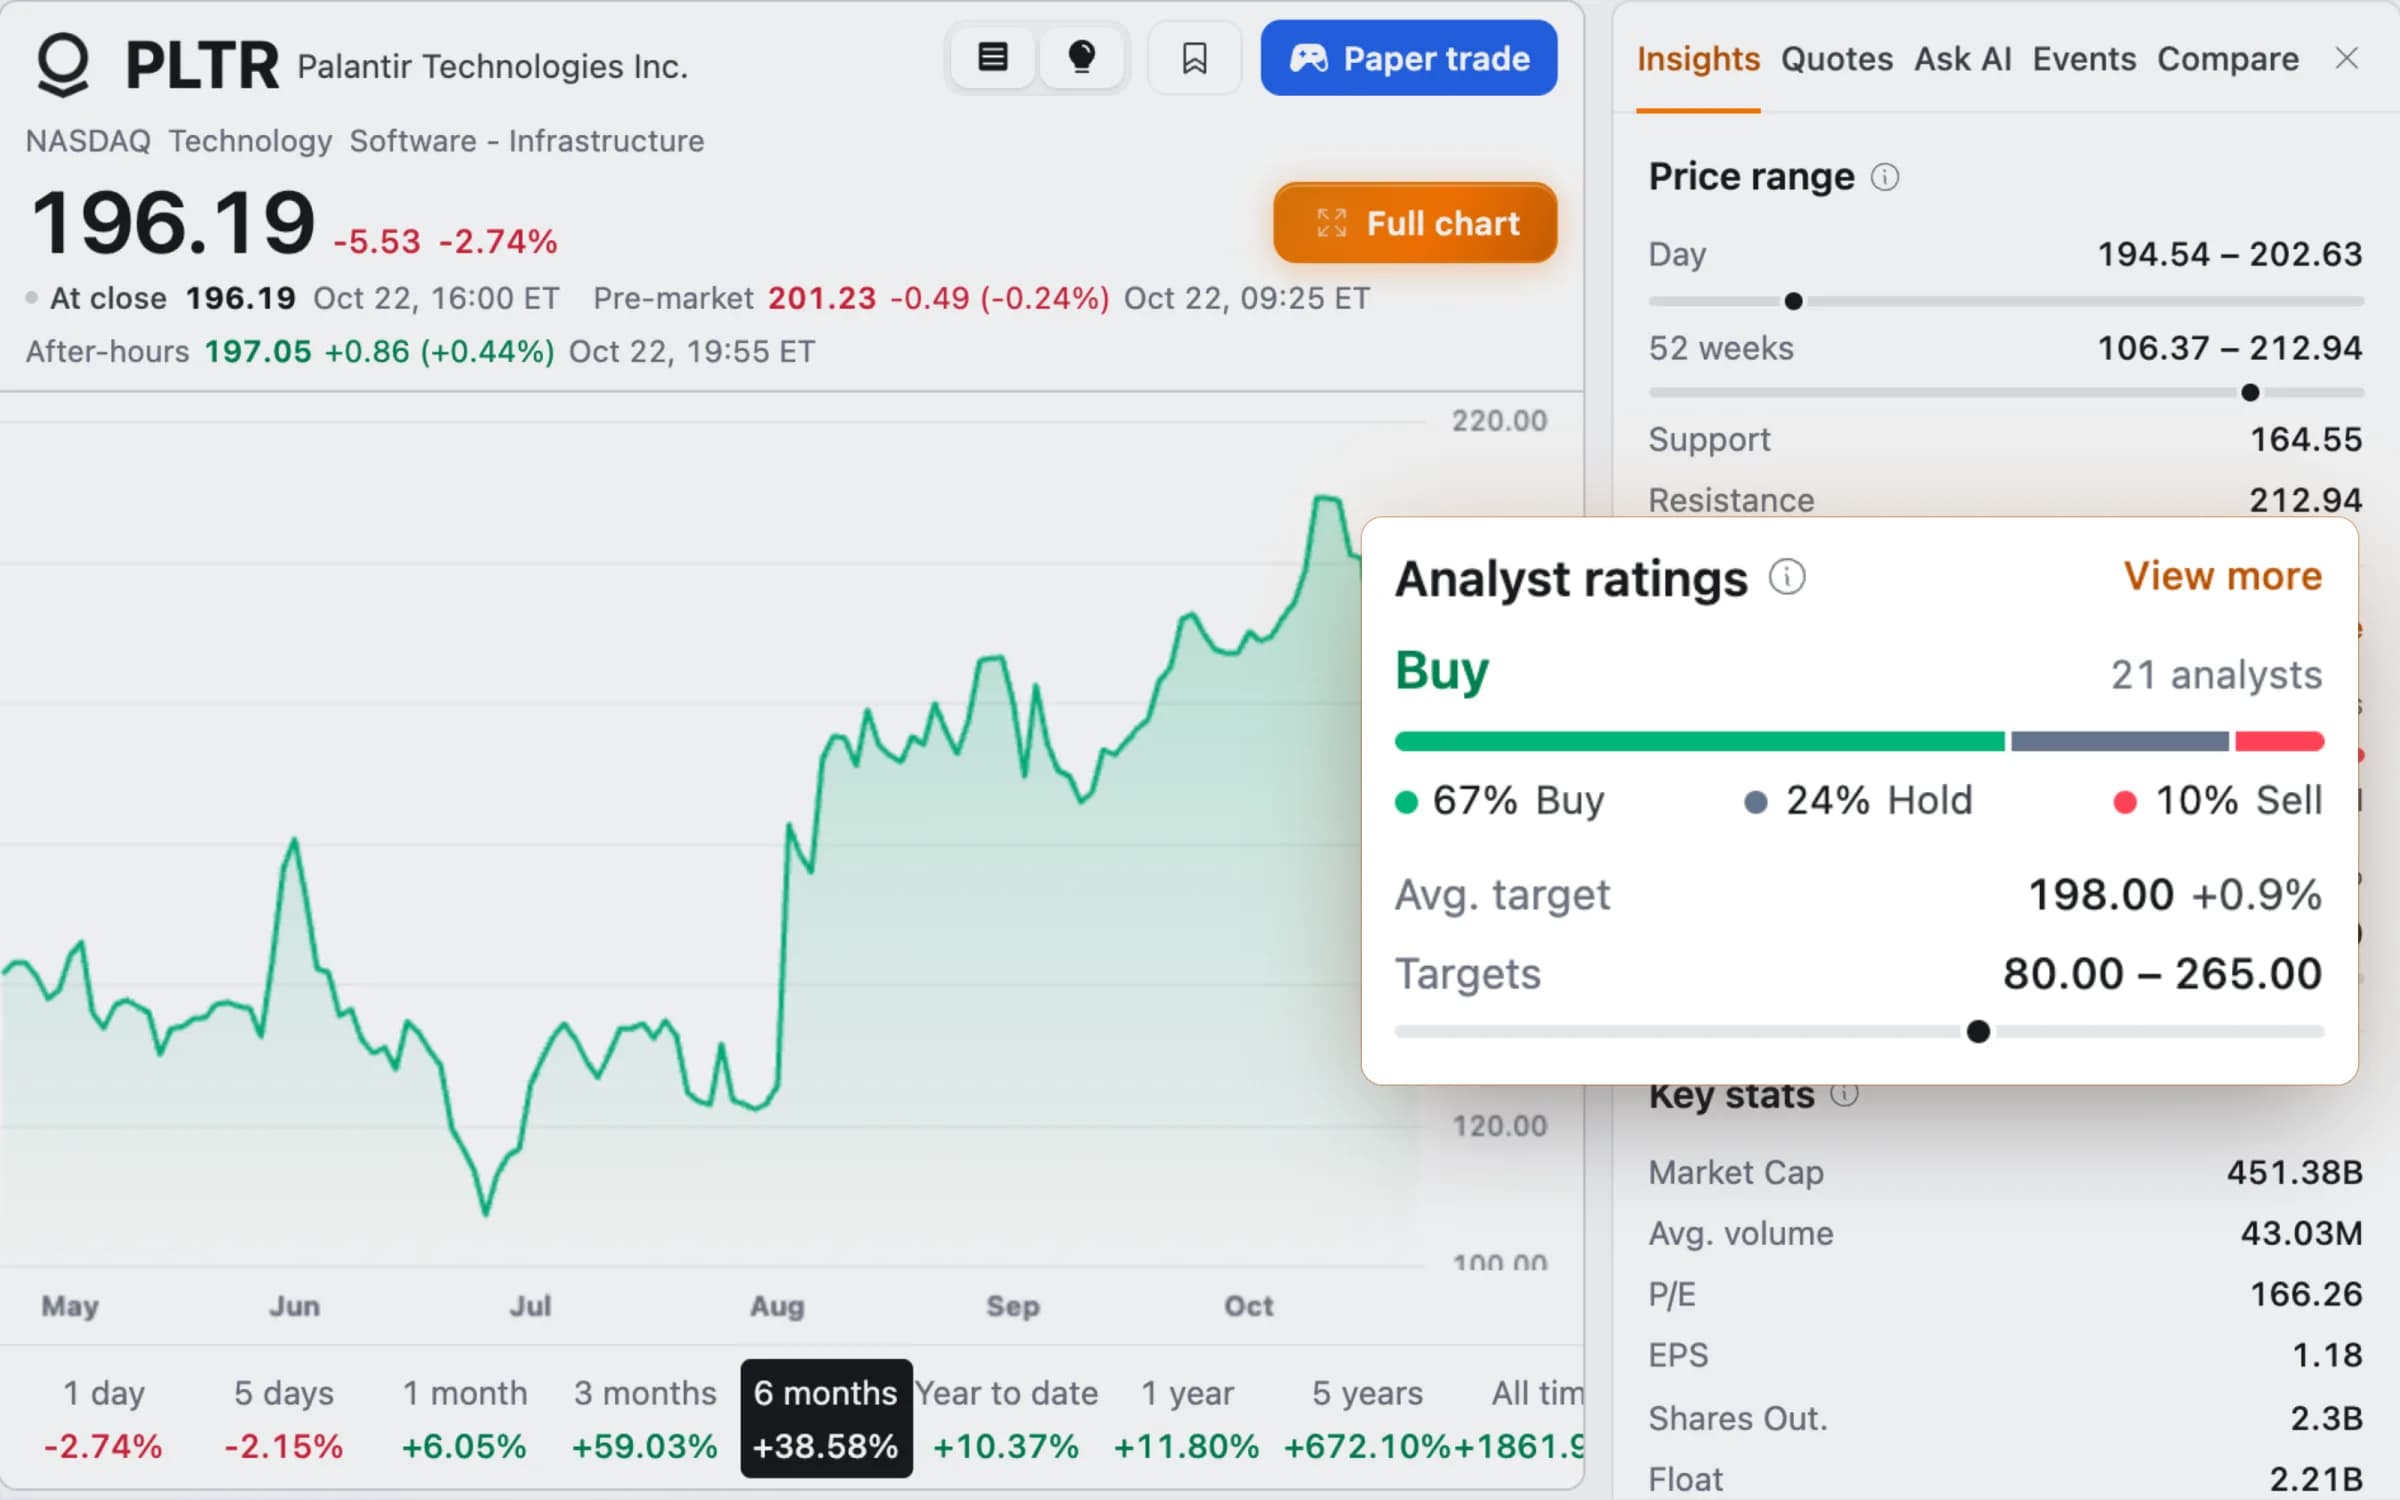
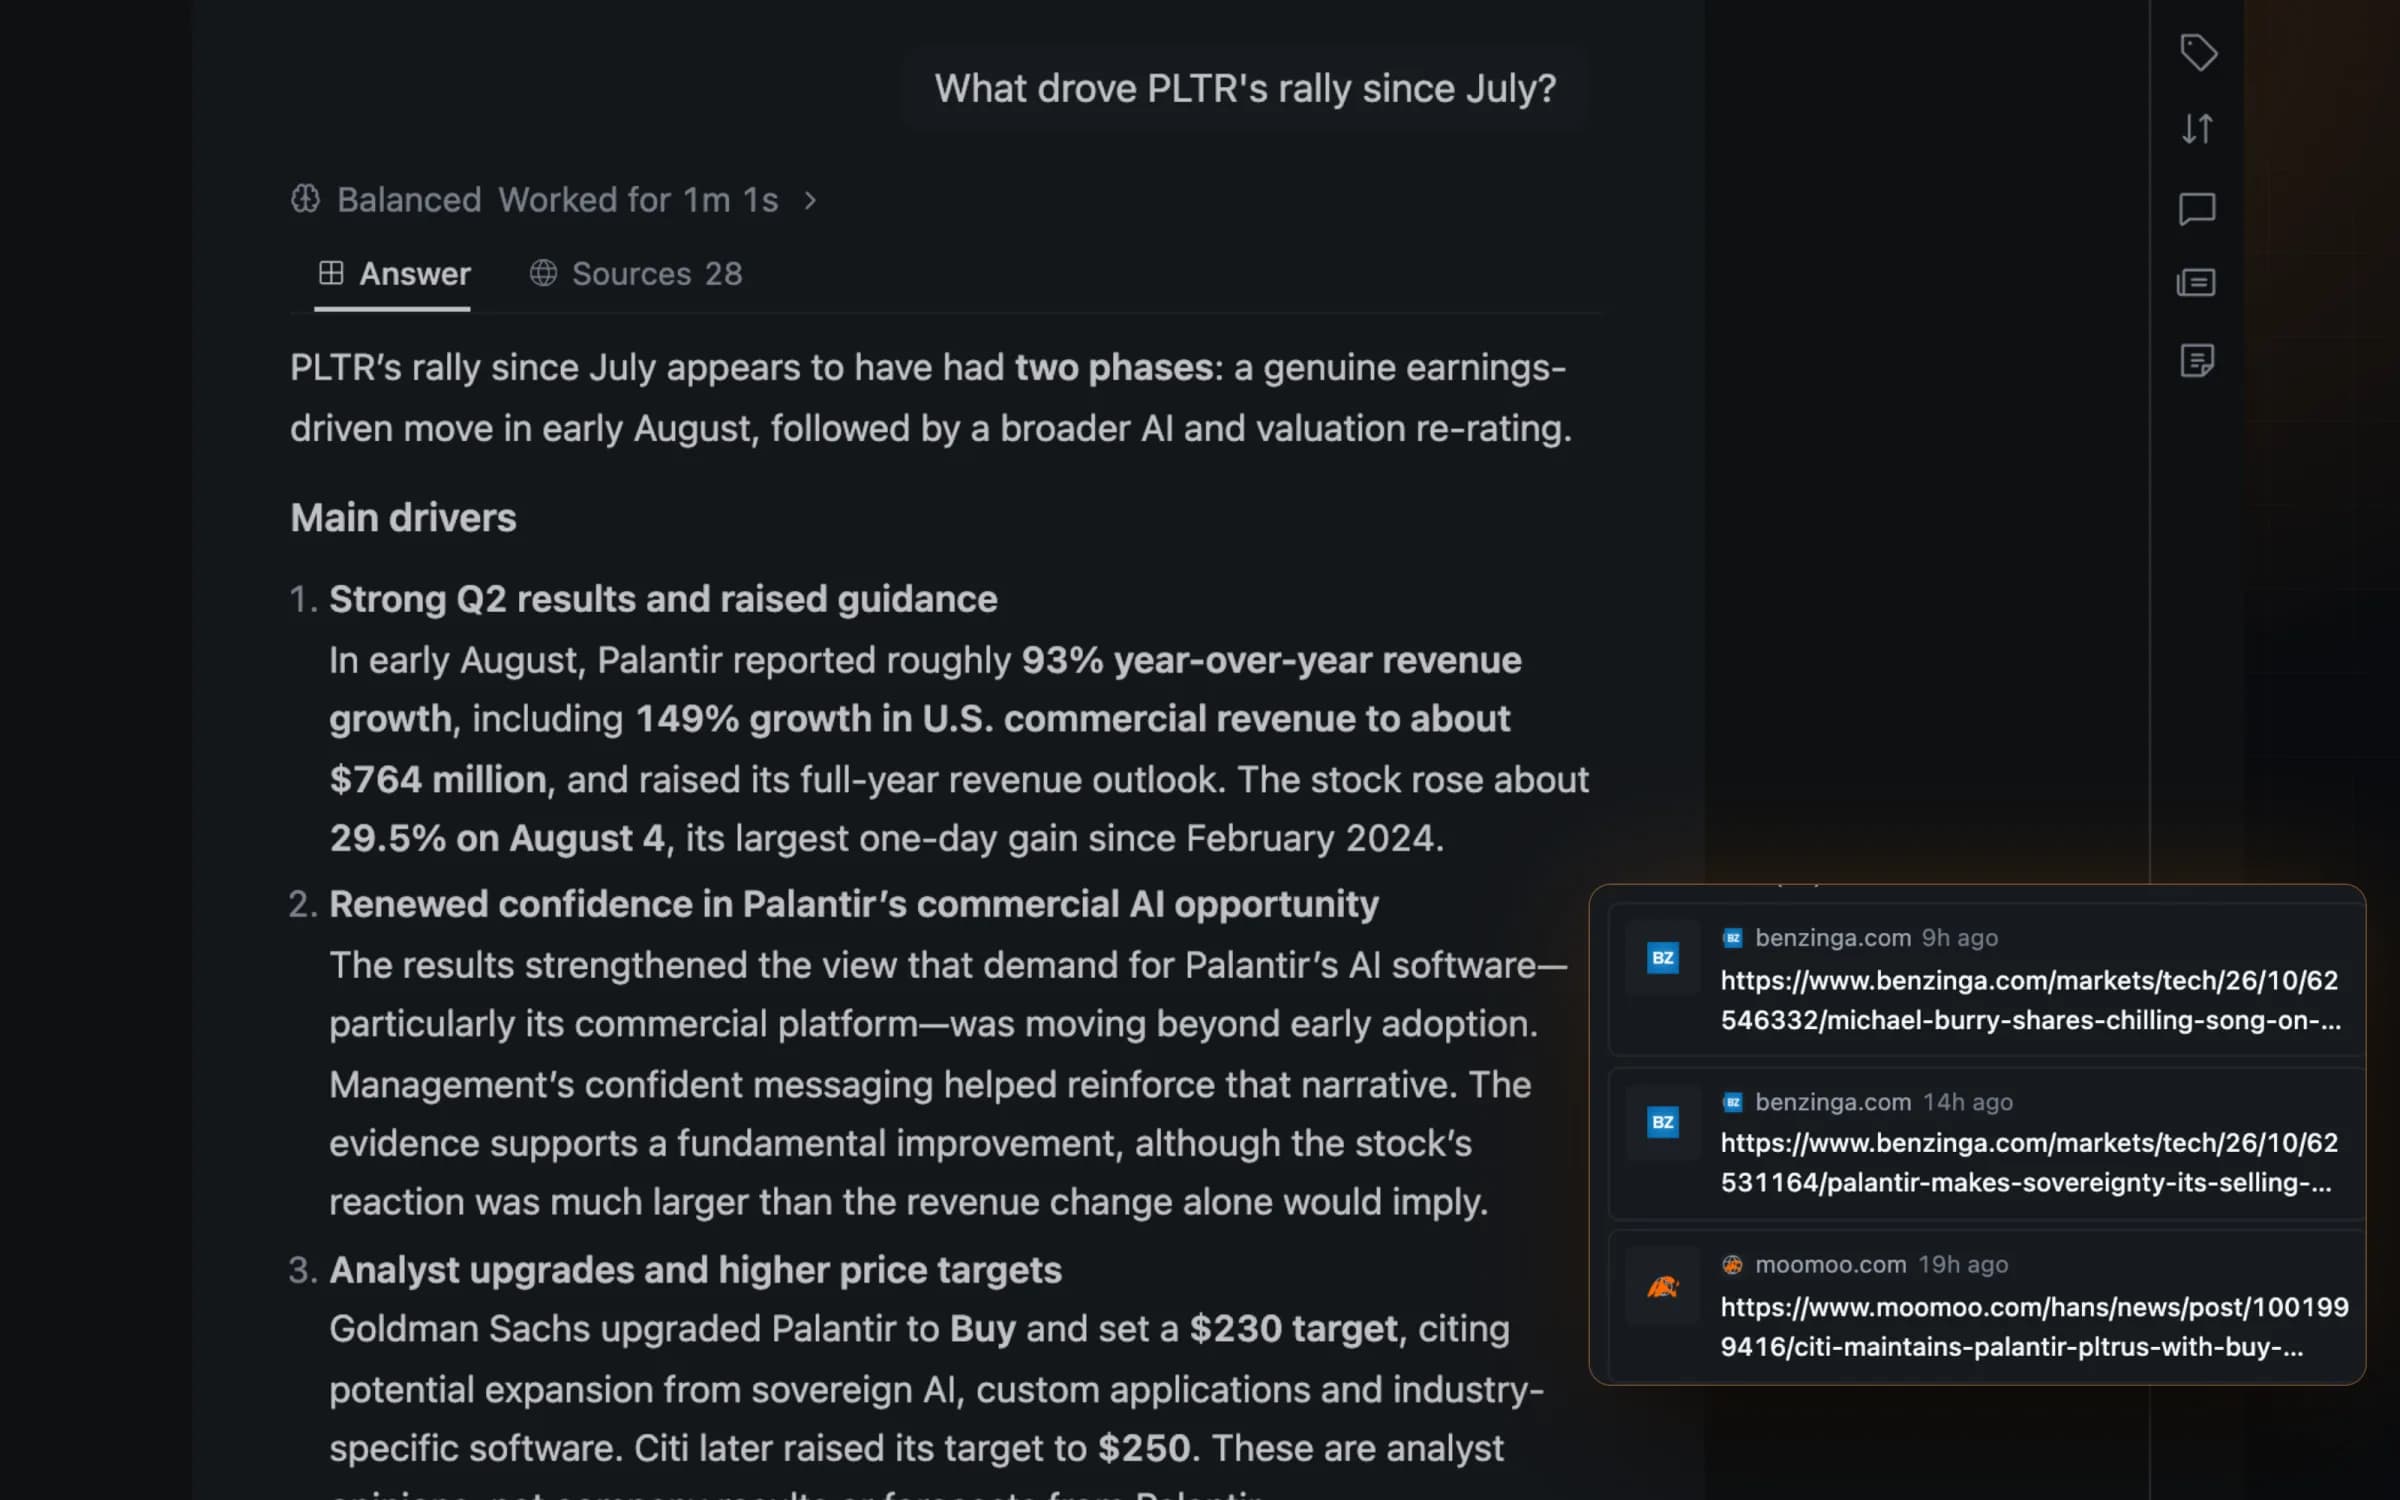
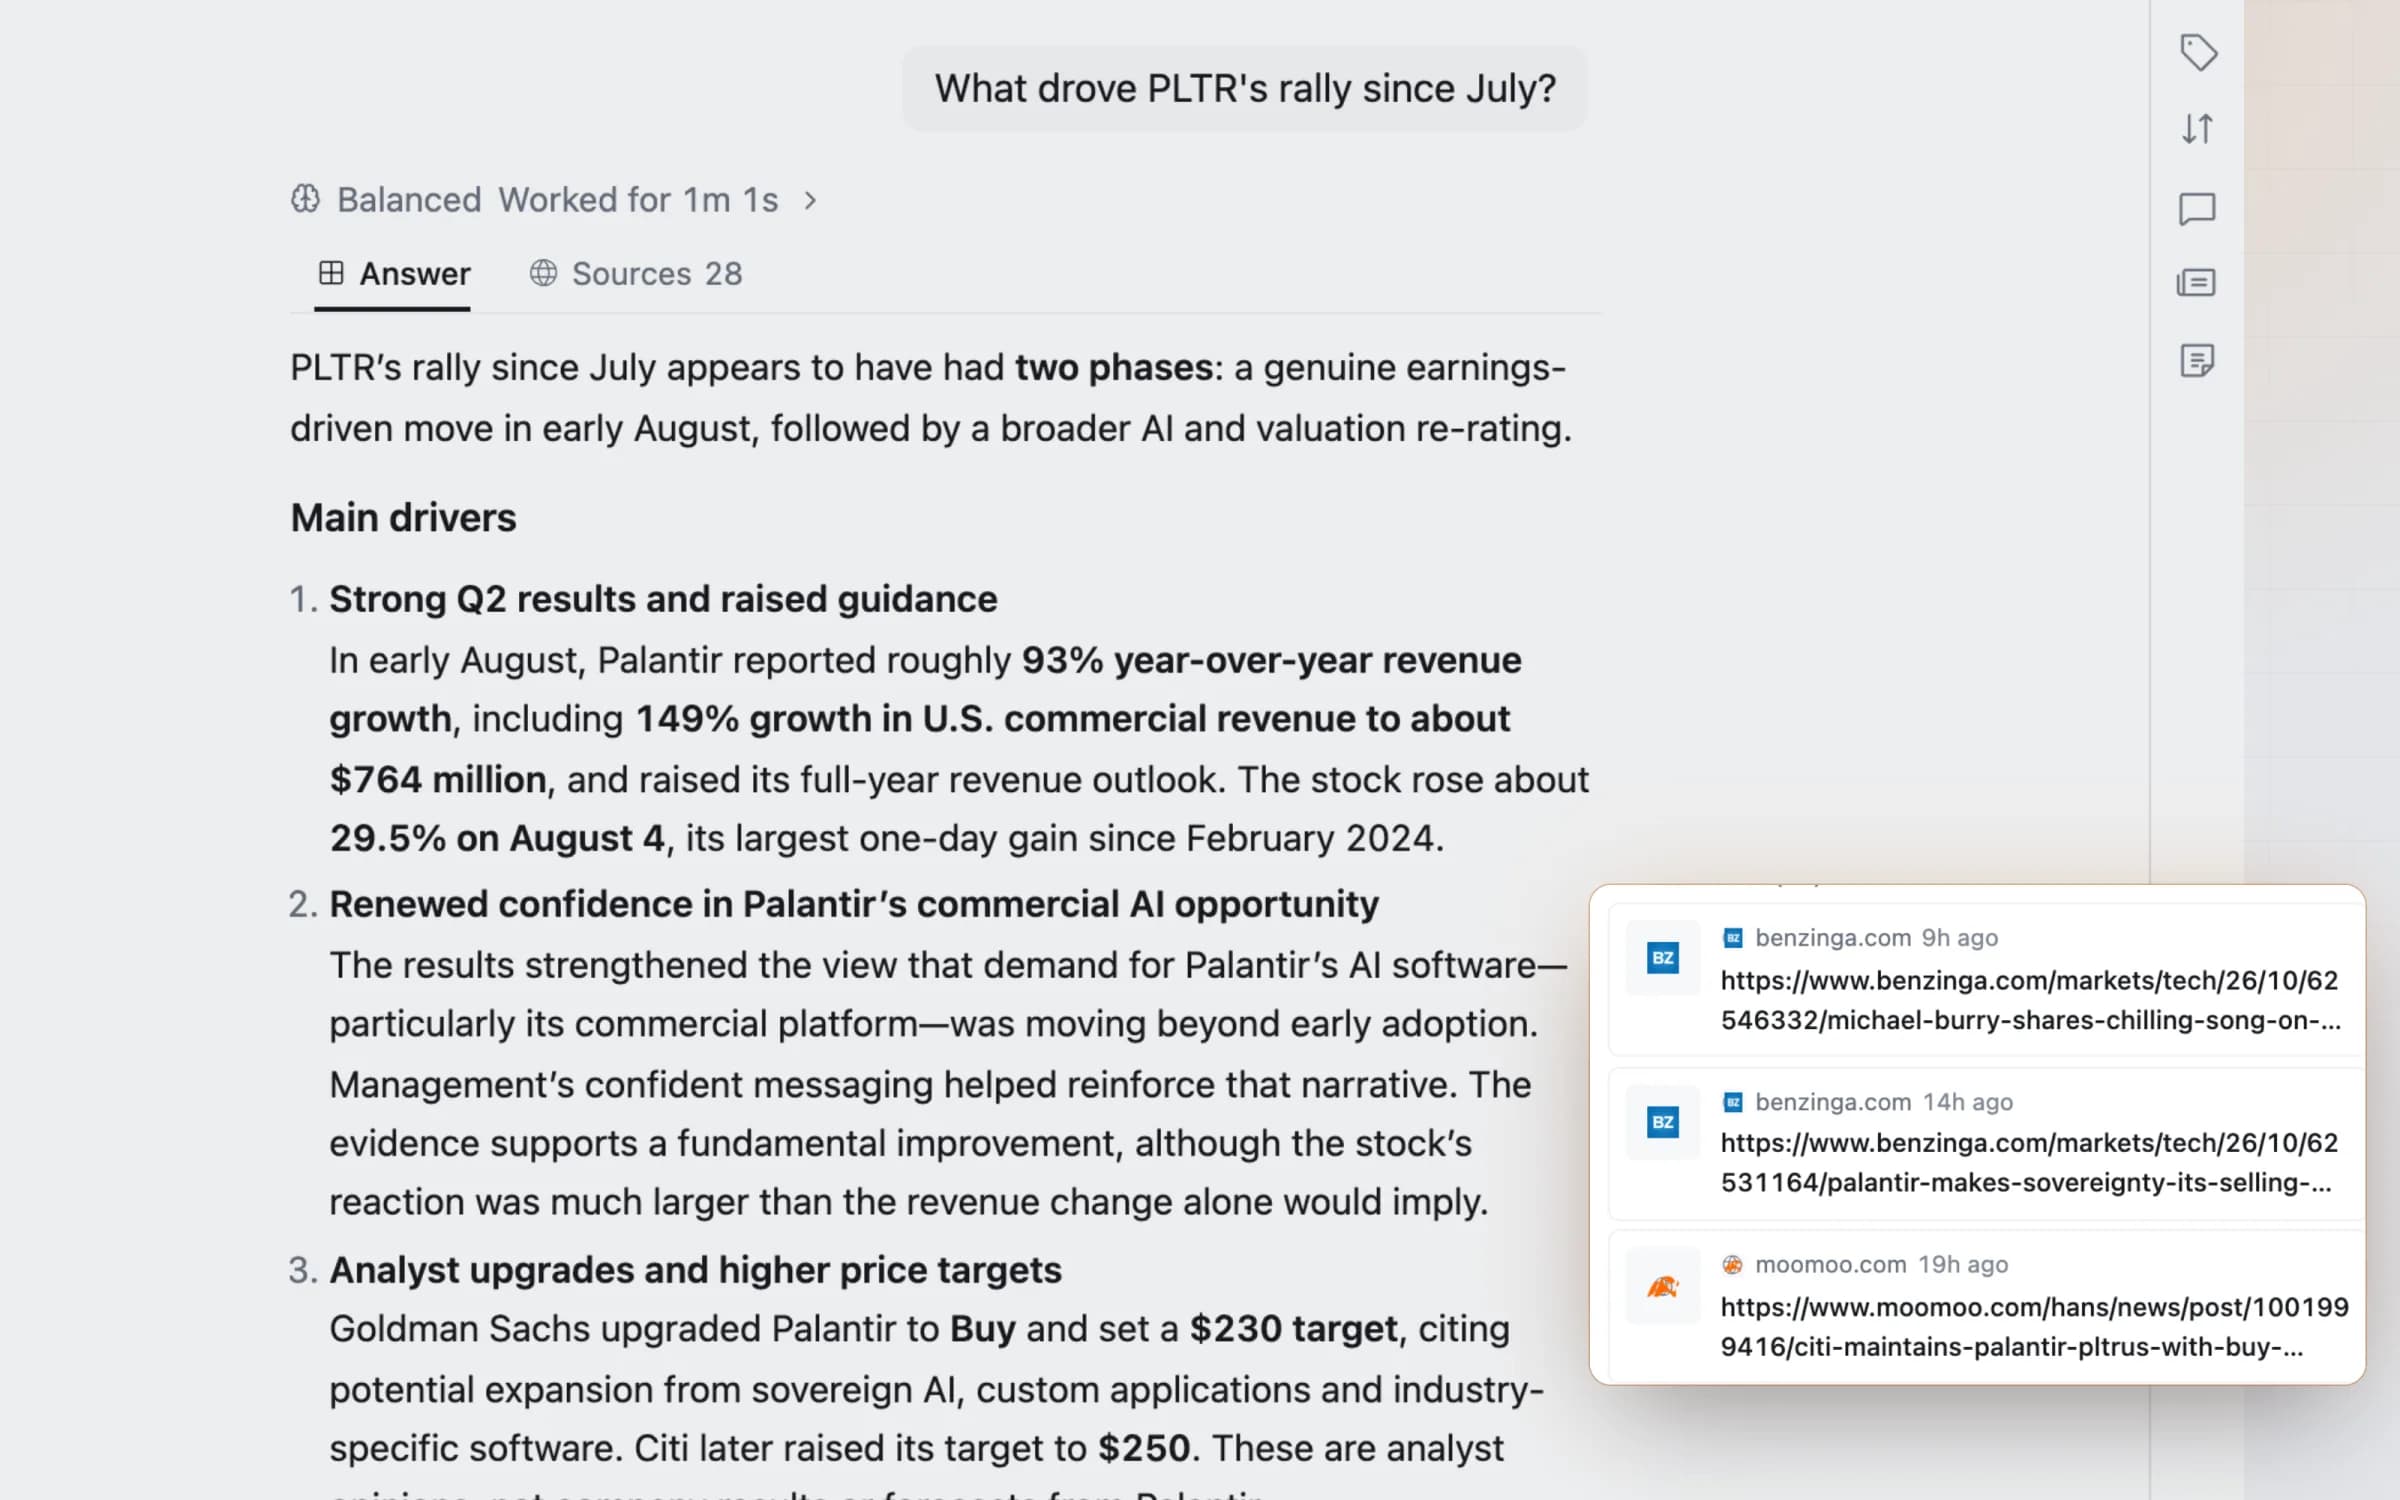
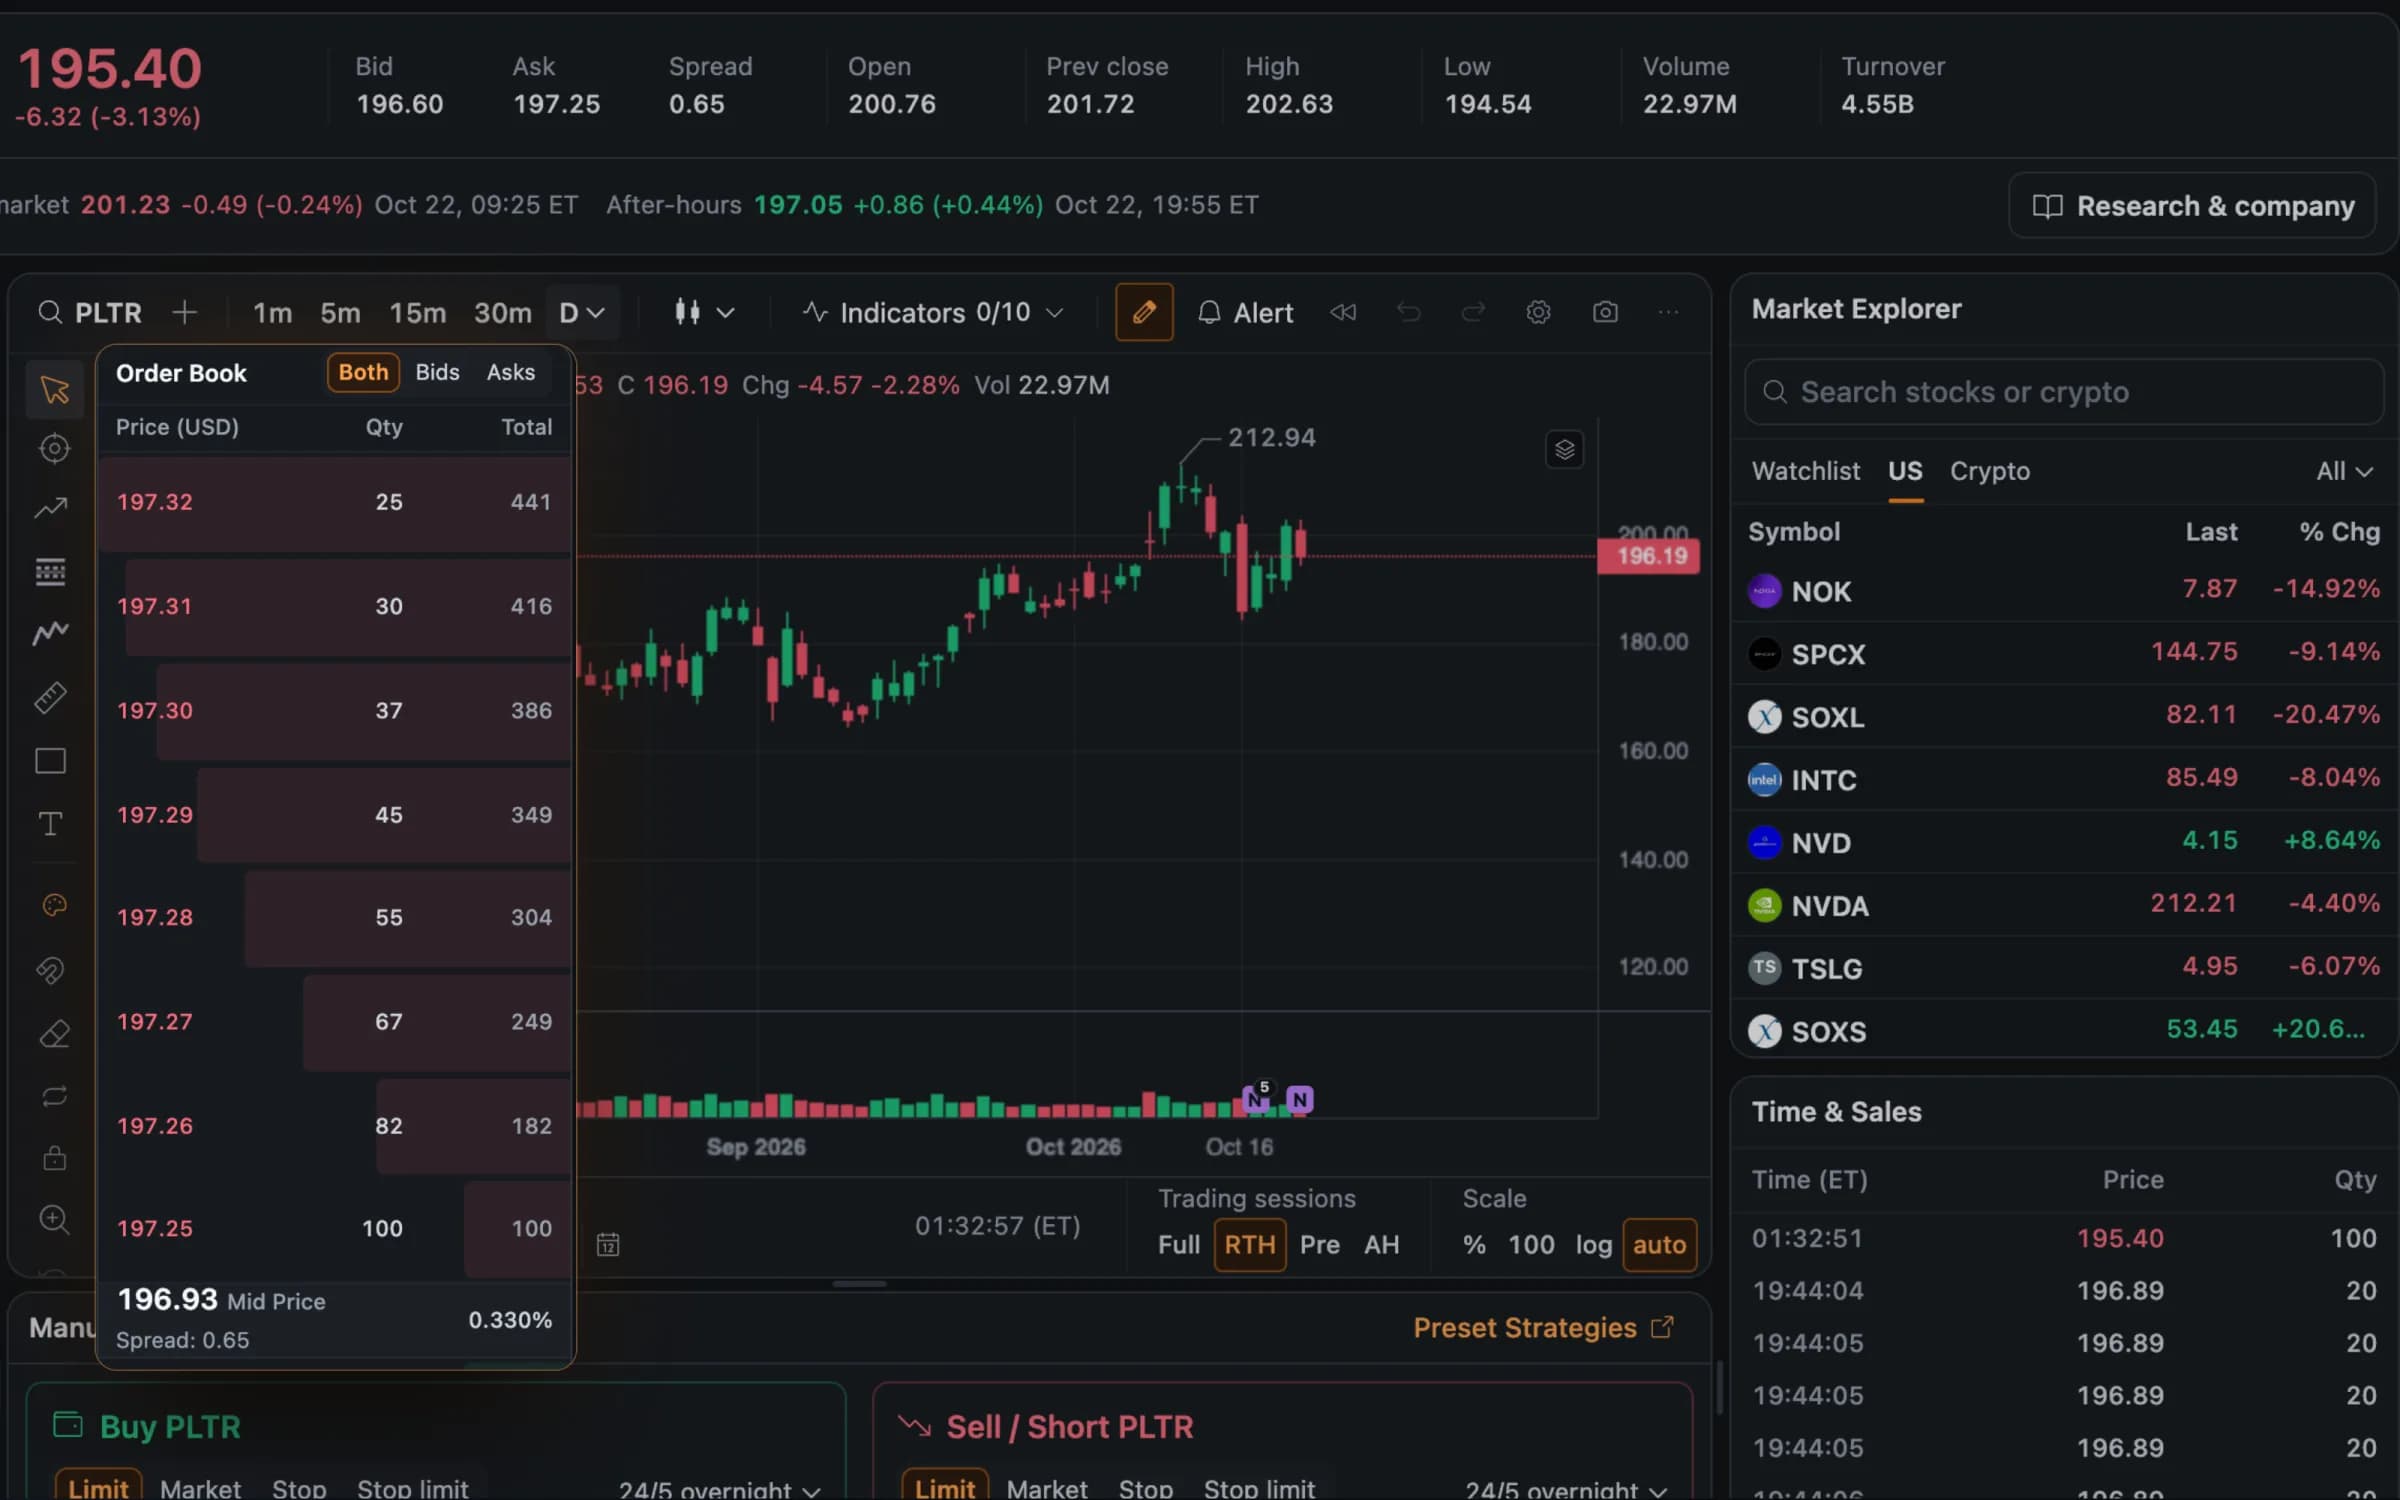
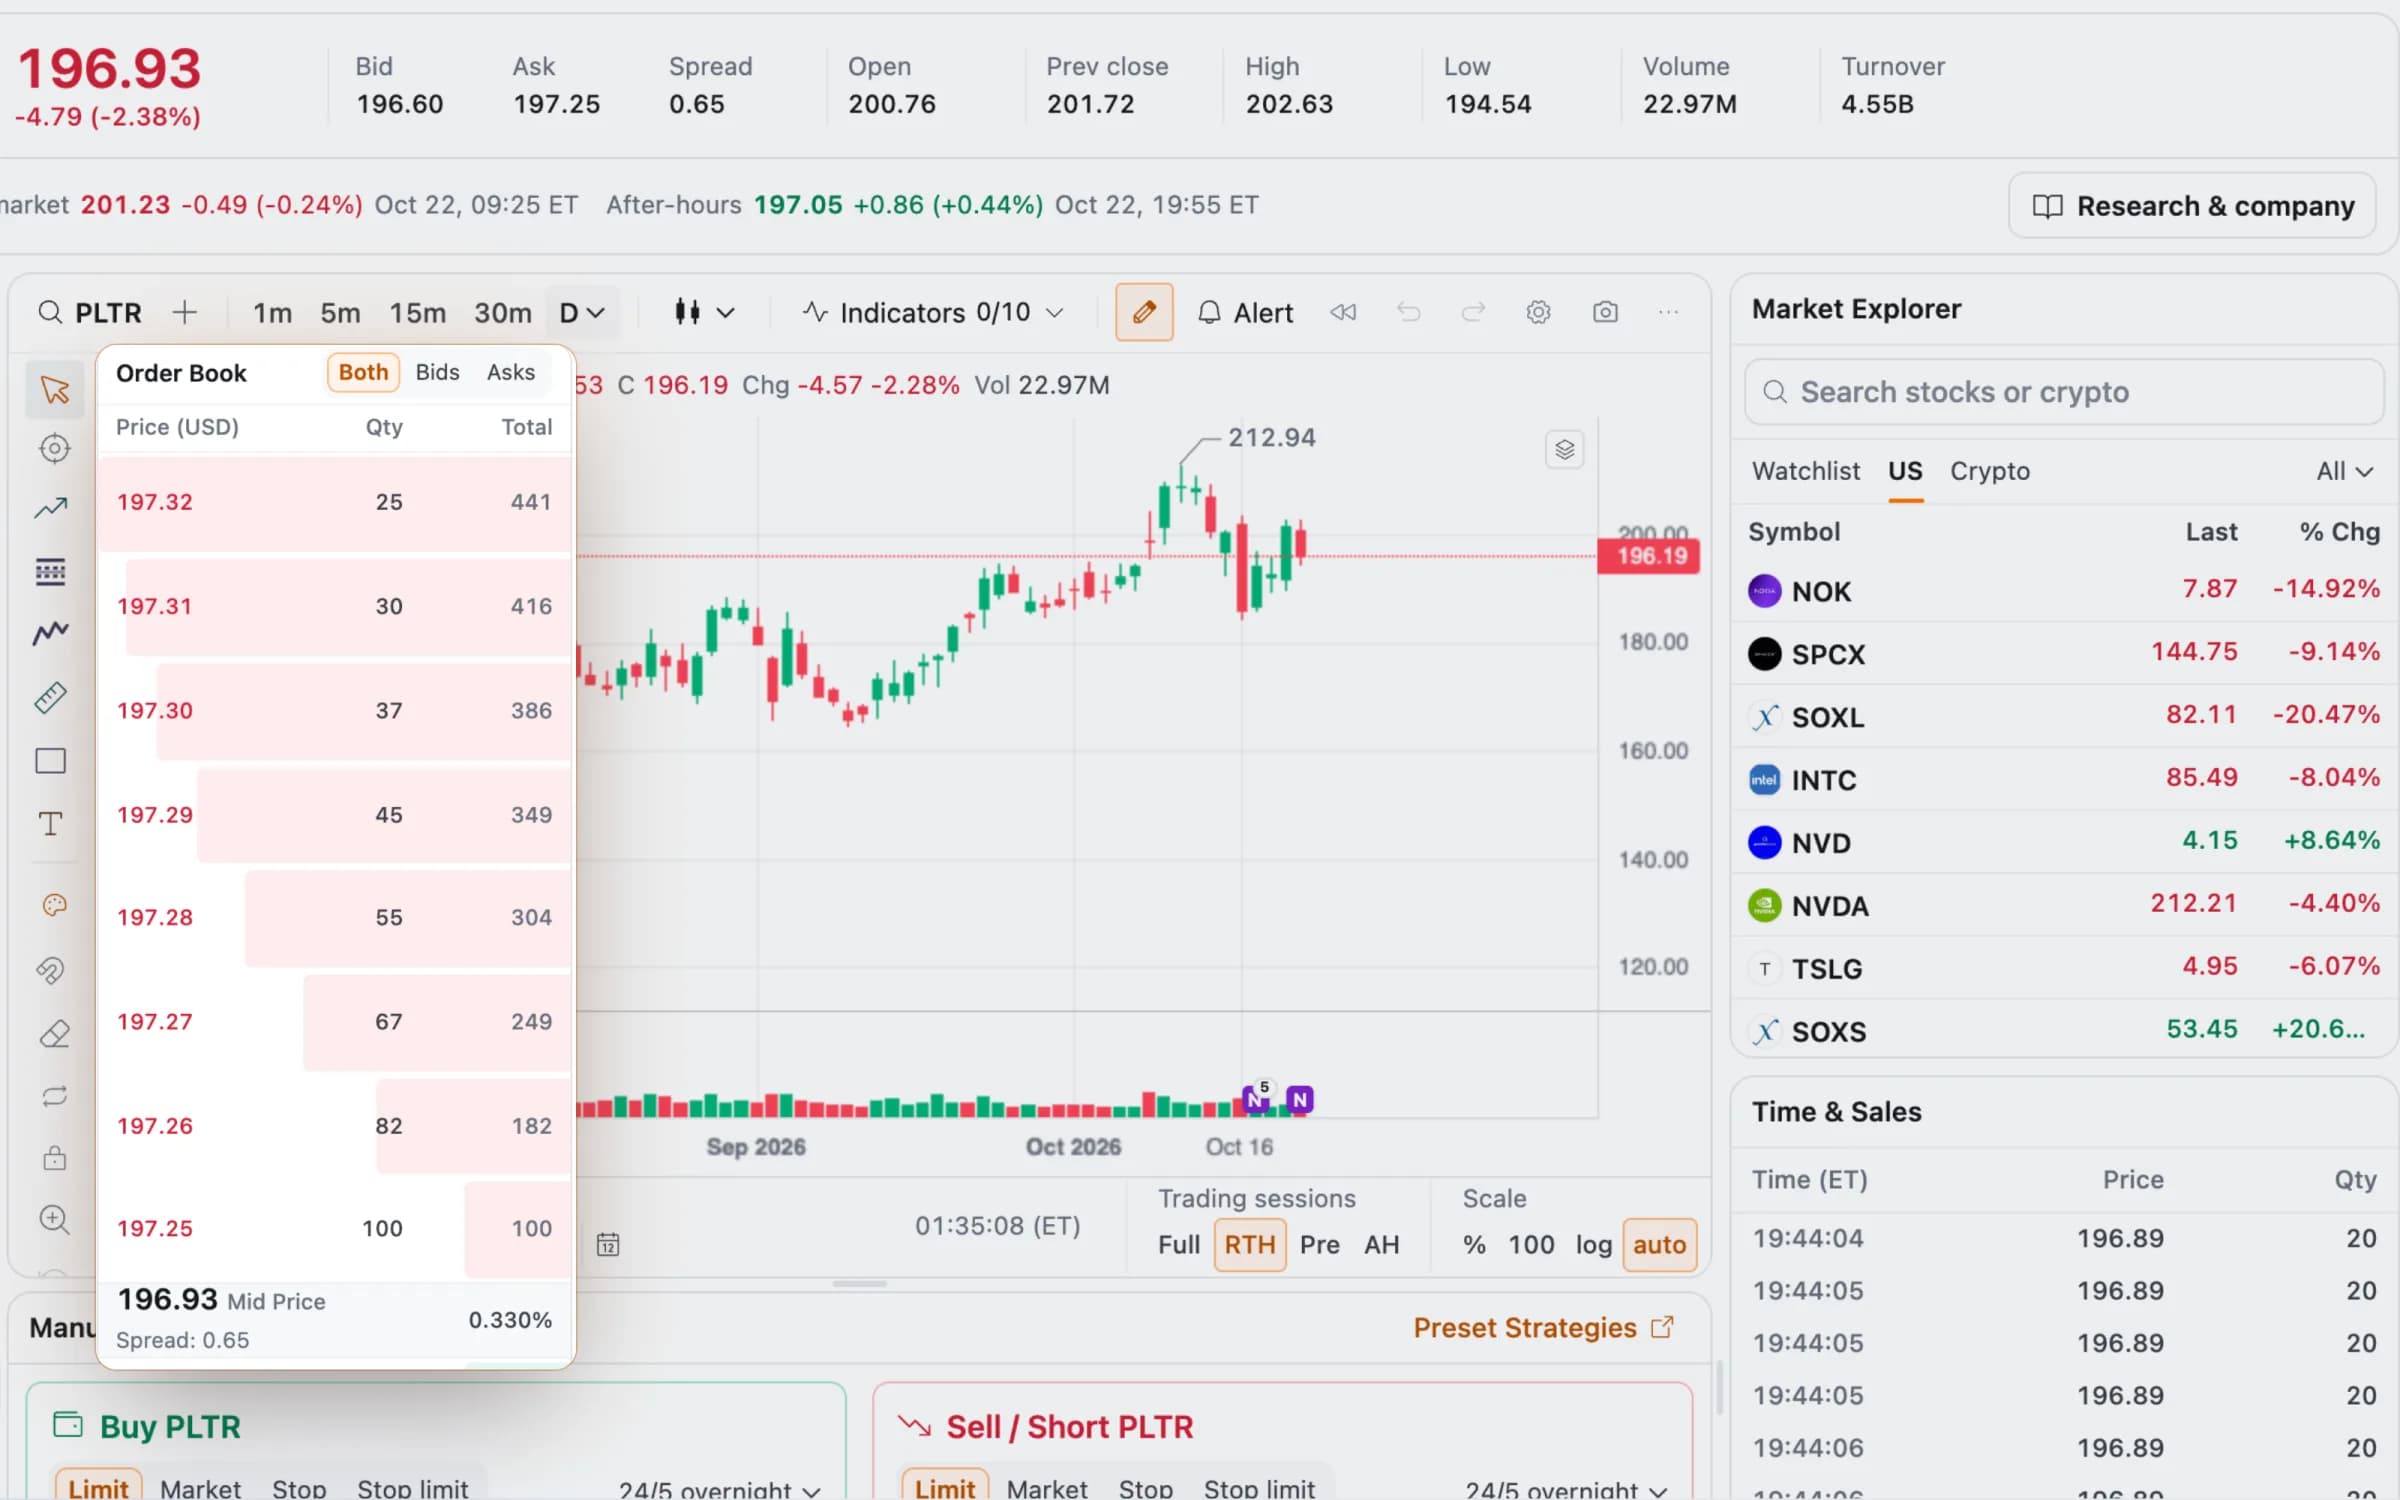
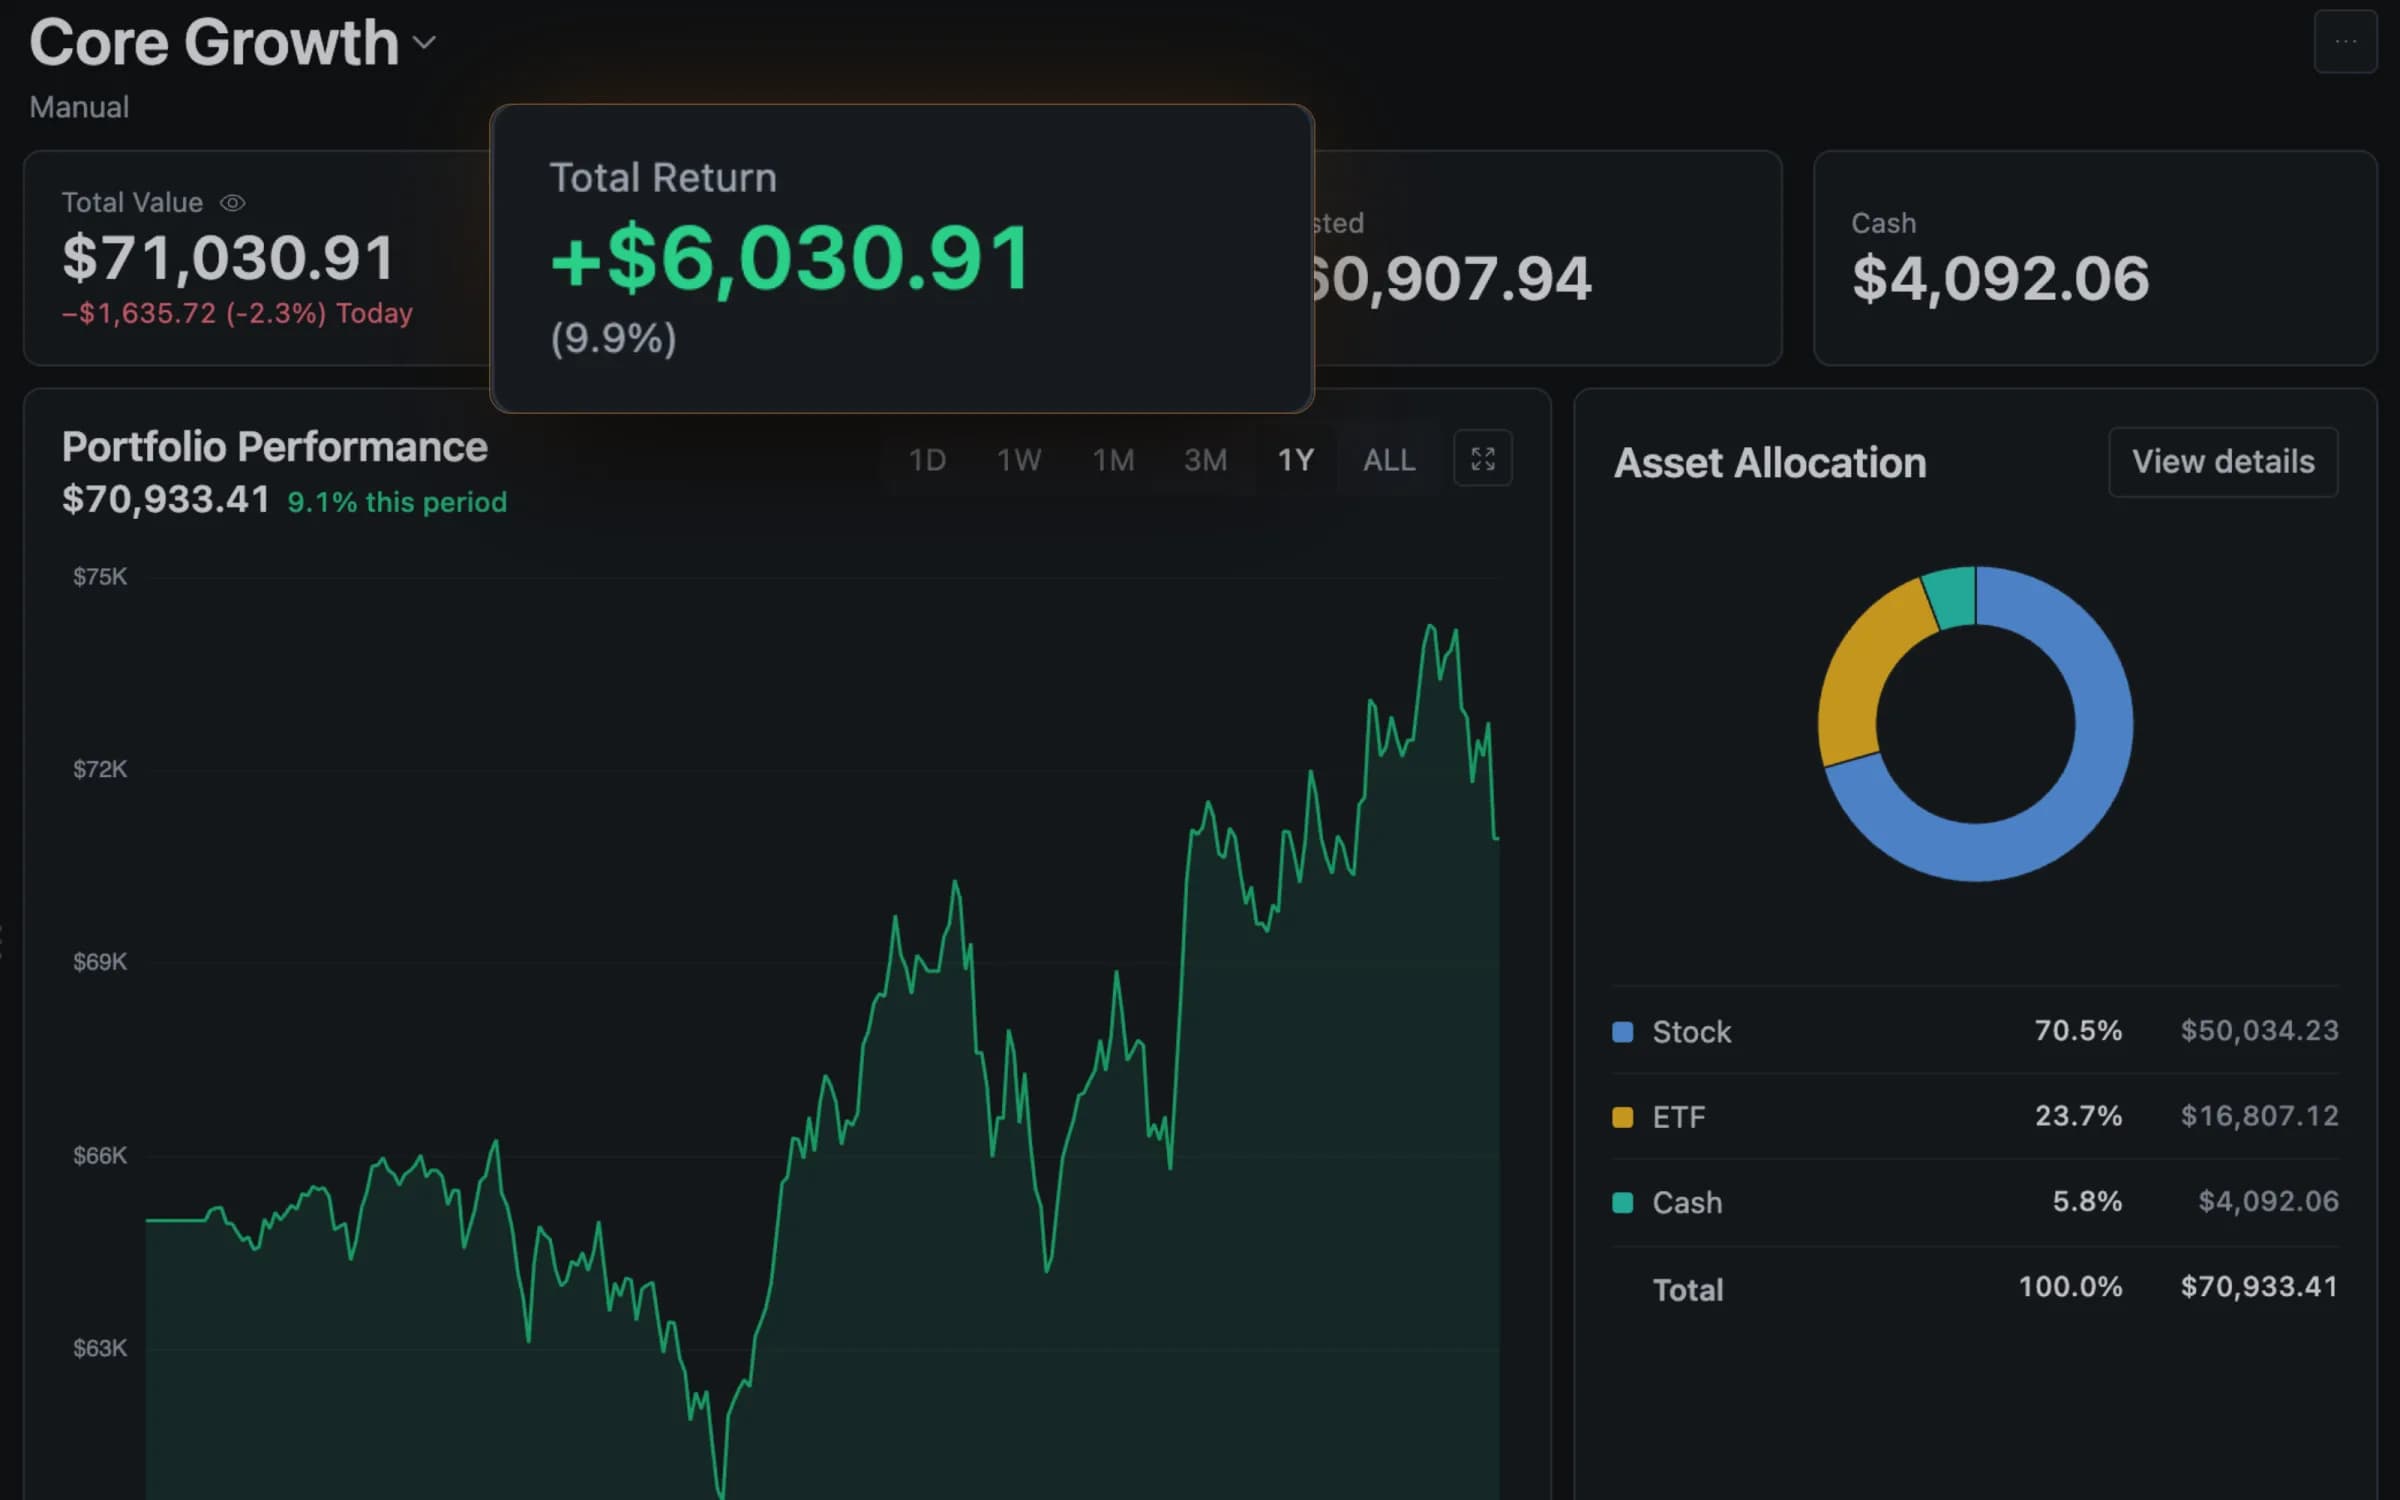
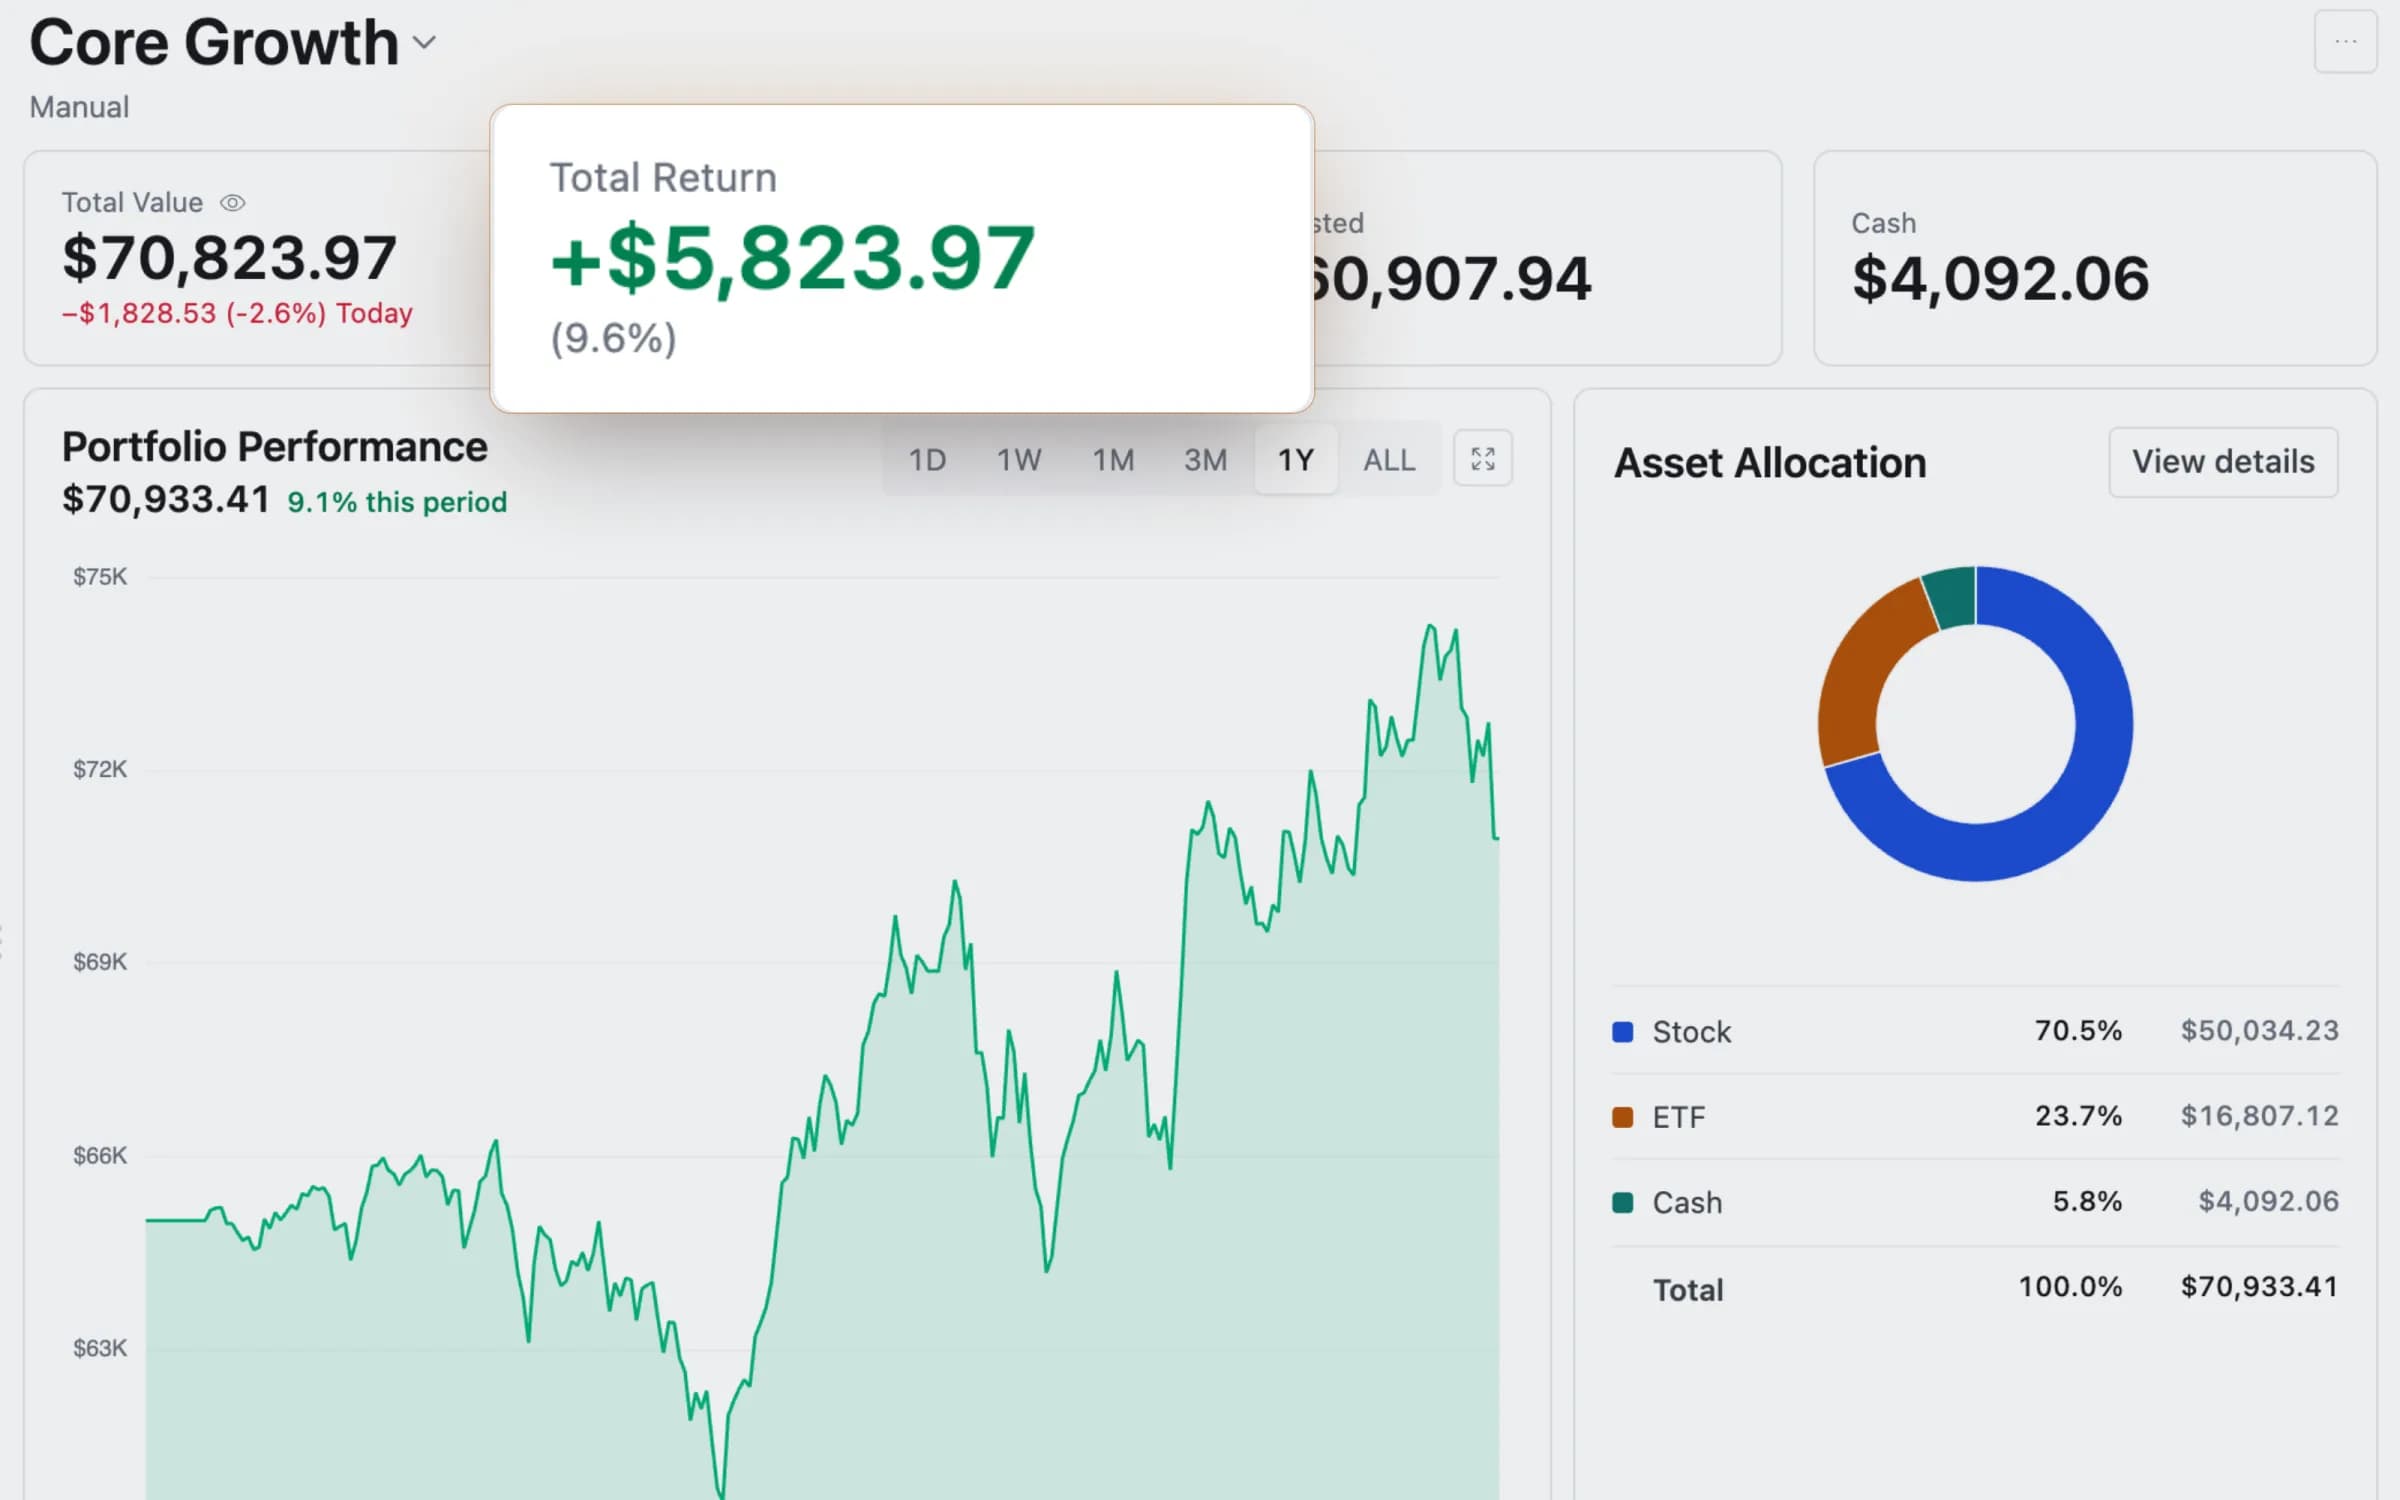
Every candle is a real trading day. Scroll to travel through the last twelve months.
S&P 500Nov 6, 2026
7,408.29+10.2%
Close on this day
Daily bars for the past year from Toponelogic market data.
US stocks & ETFs
Quotes, charts and company data
Crypto
Major coins alongside your stocks
Fundamentals
Financials, earnings, dividends, holders
Technicals
Intervals from 1 minute, indicators, drawings
News & sentiment
Headlines and the Fear & Greed reading
Real product, real market data. Scroll to play each film.
Ask the AI Copilot about a company, a market move or your own portfolio. Answers lay out the figures they rely on, with dates, and mark how many were confirmed by sources.
Ask the AI CopilotProof over promises
What the product worked out from the latest market data. Open any card to see how it was done.
23.6×
$188.48 divided by $7.97 of earnings over the last twelve months, each figure tied to its source.
157 of 6,799
Market cap over $10B, a dividend yield of 3% or more and a P/E under 20, run on the whole universe.
+24.2%
5 years of daily closes. Buy and hold made +63.4% over the same span, and we show that too.
+2.10%
Consumer staples trailed at -2.22%, out of all eleven sectors.
$11,193
NVDA, AAPL, MSFT and SPY in equal parts, never rebalanced: +11.9%.
3
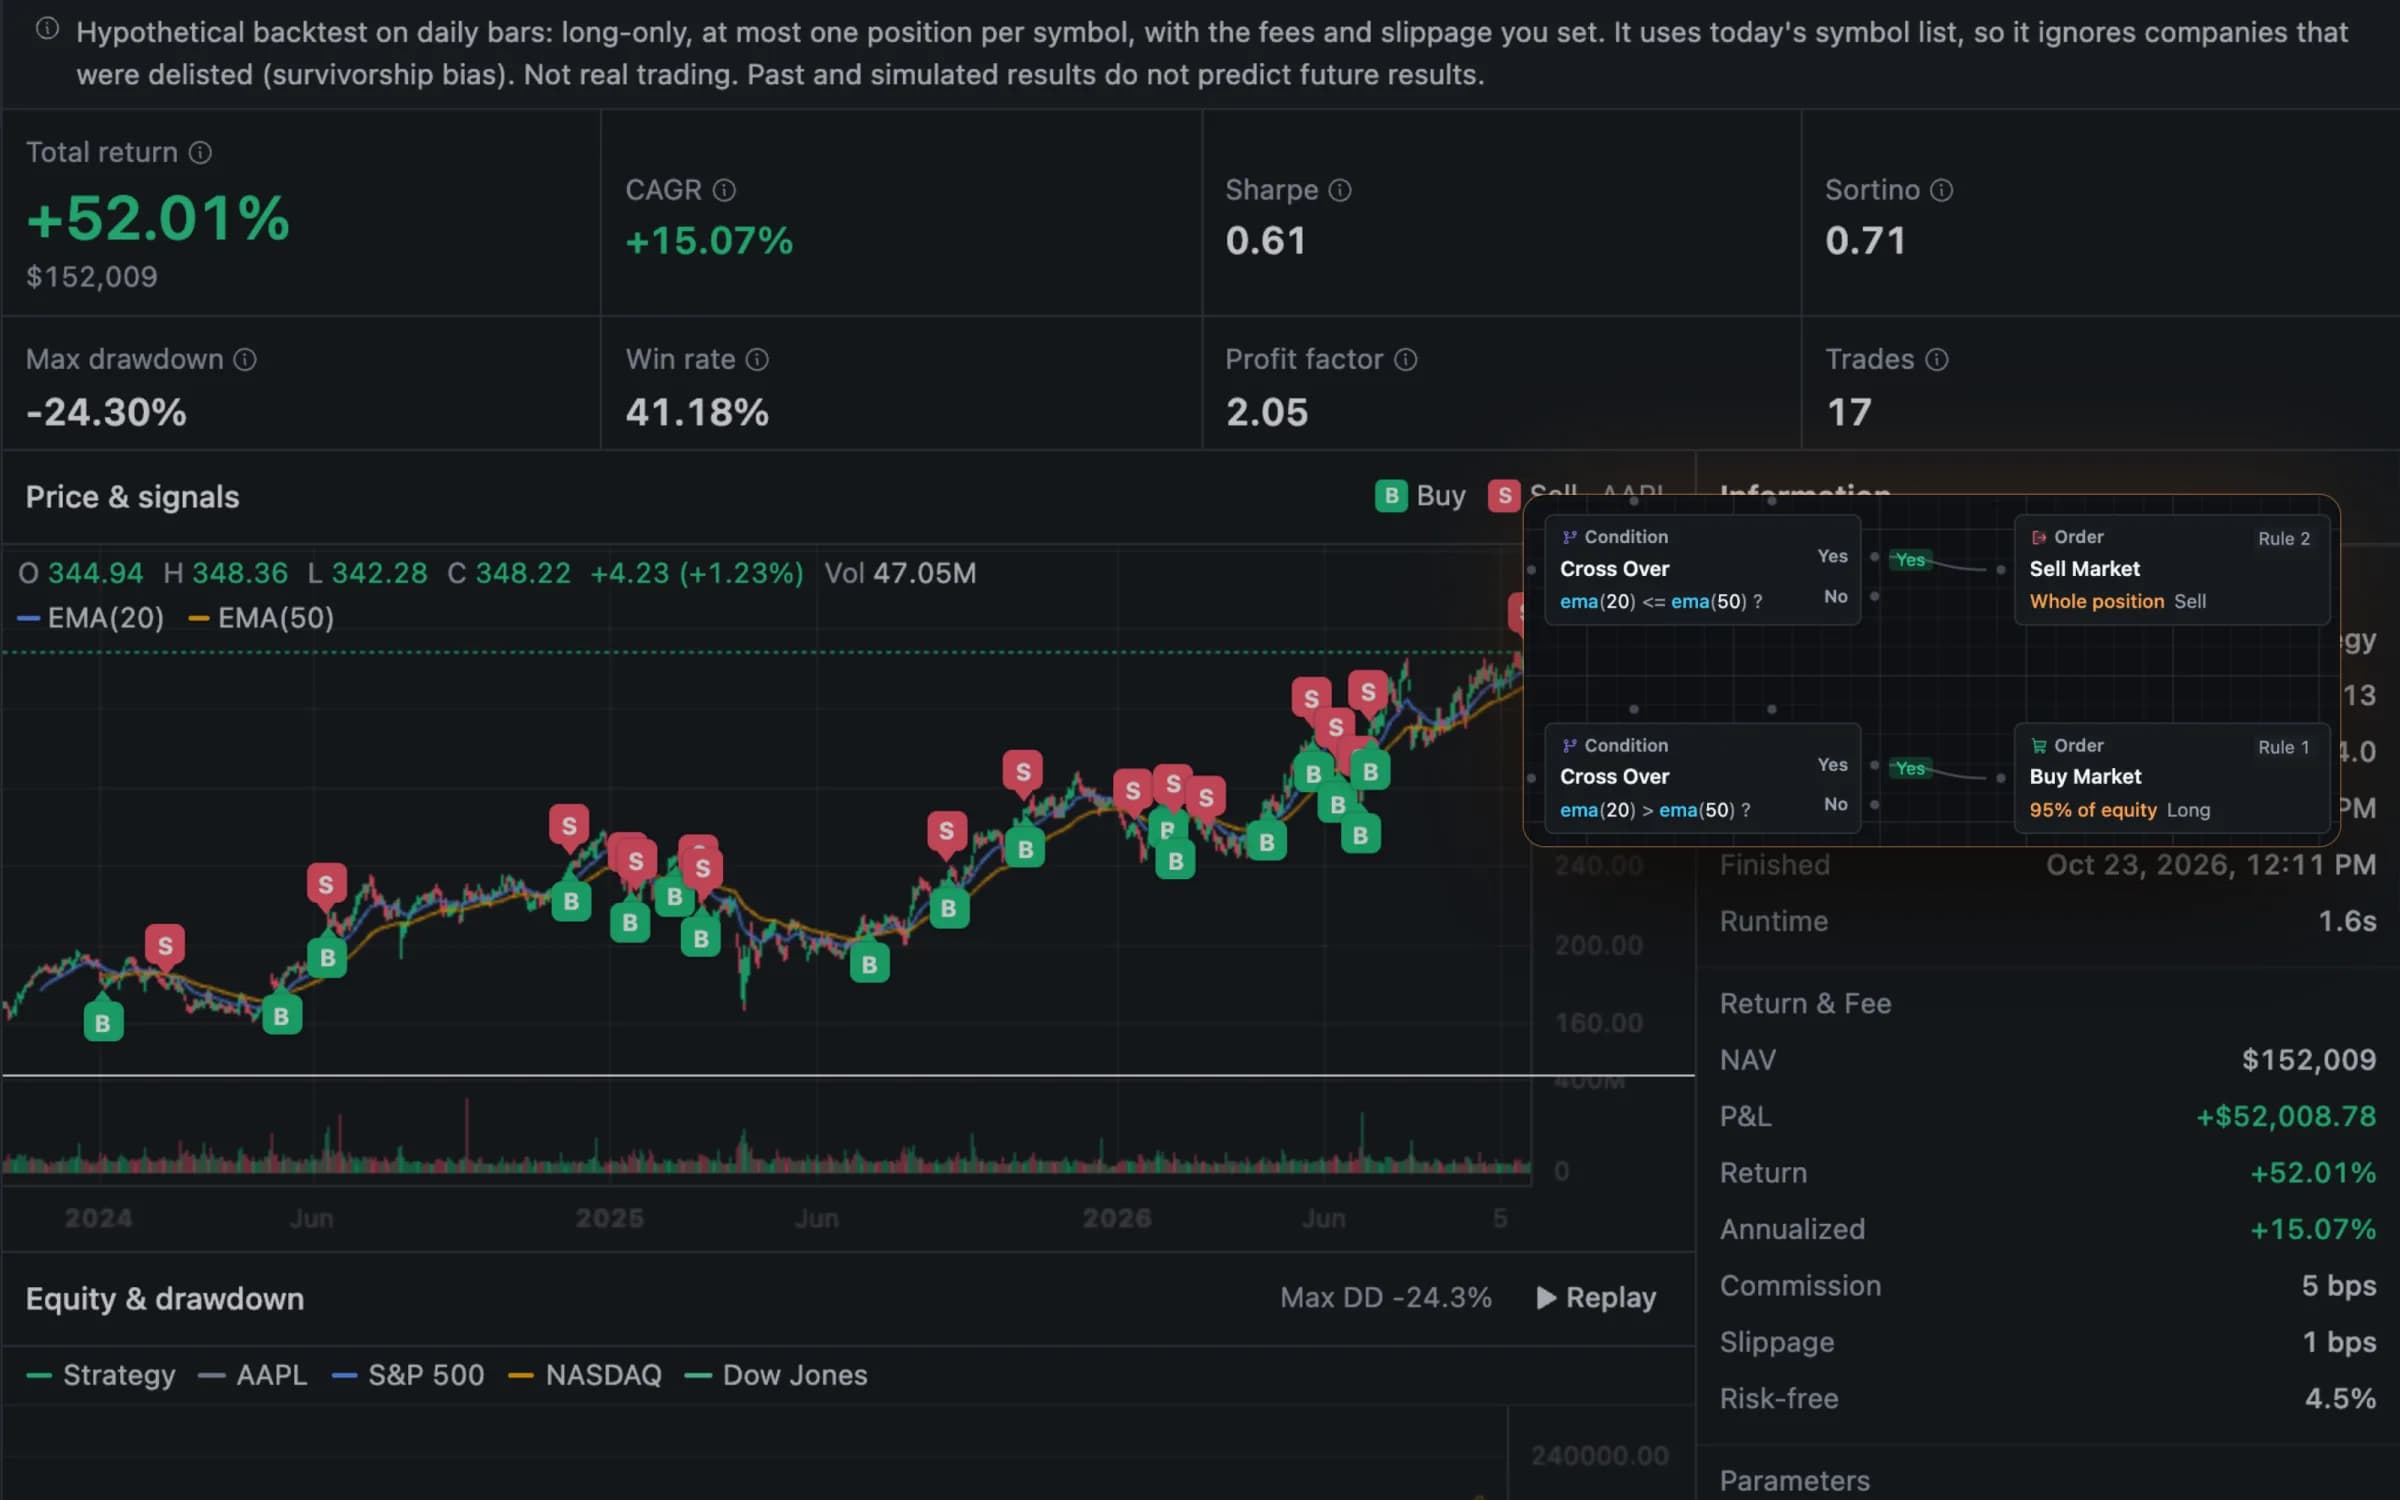
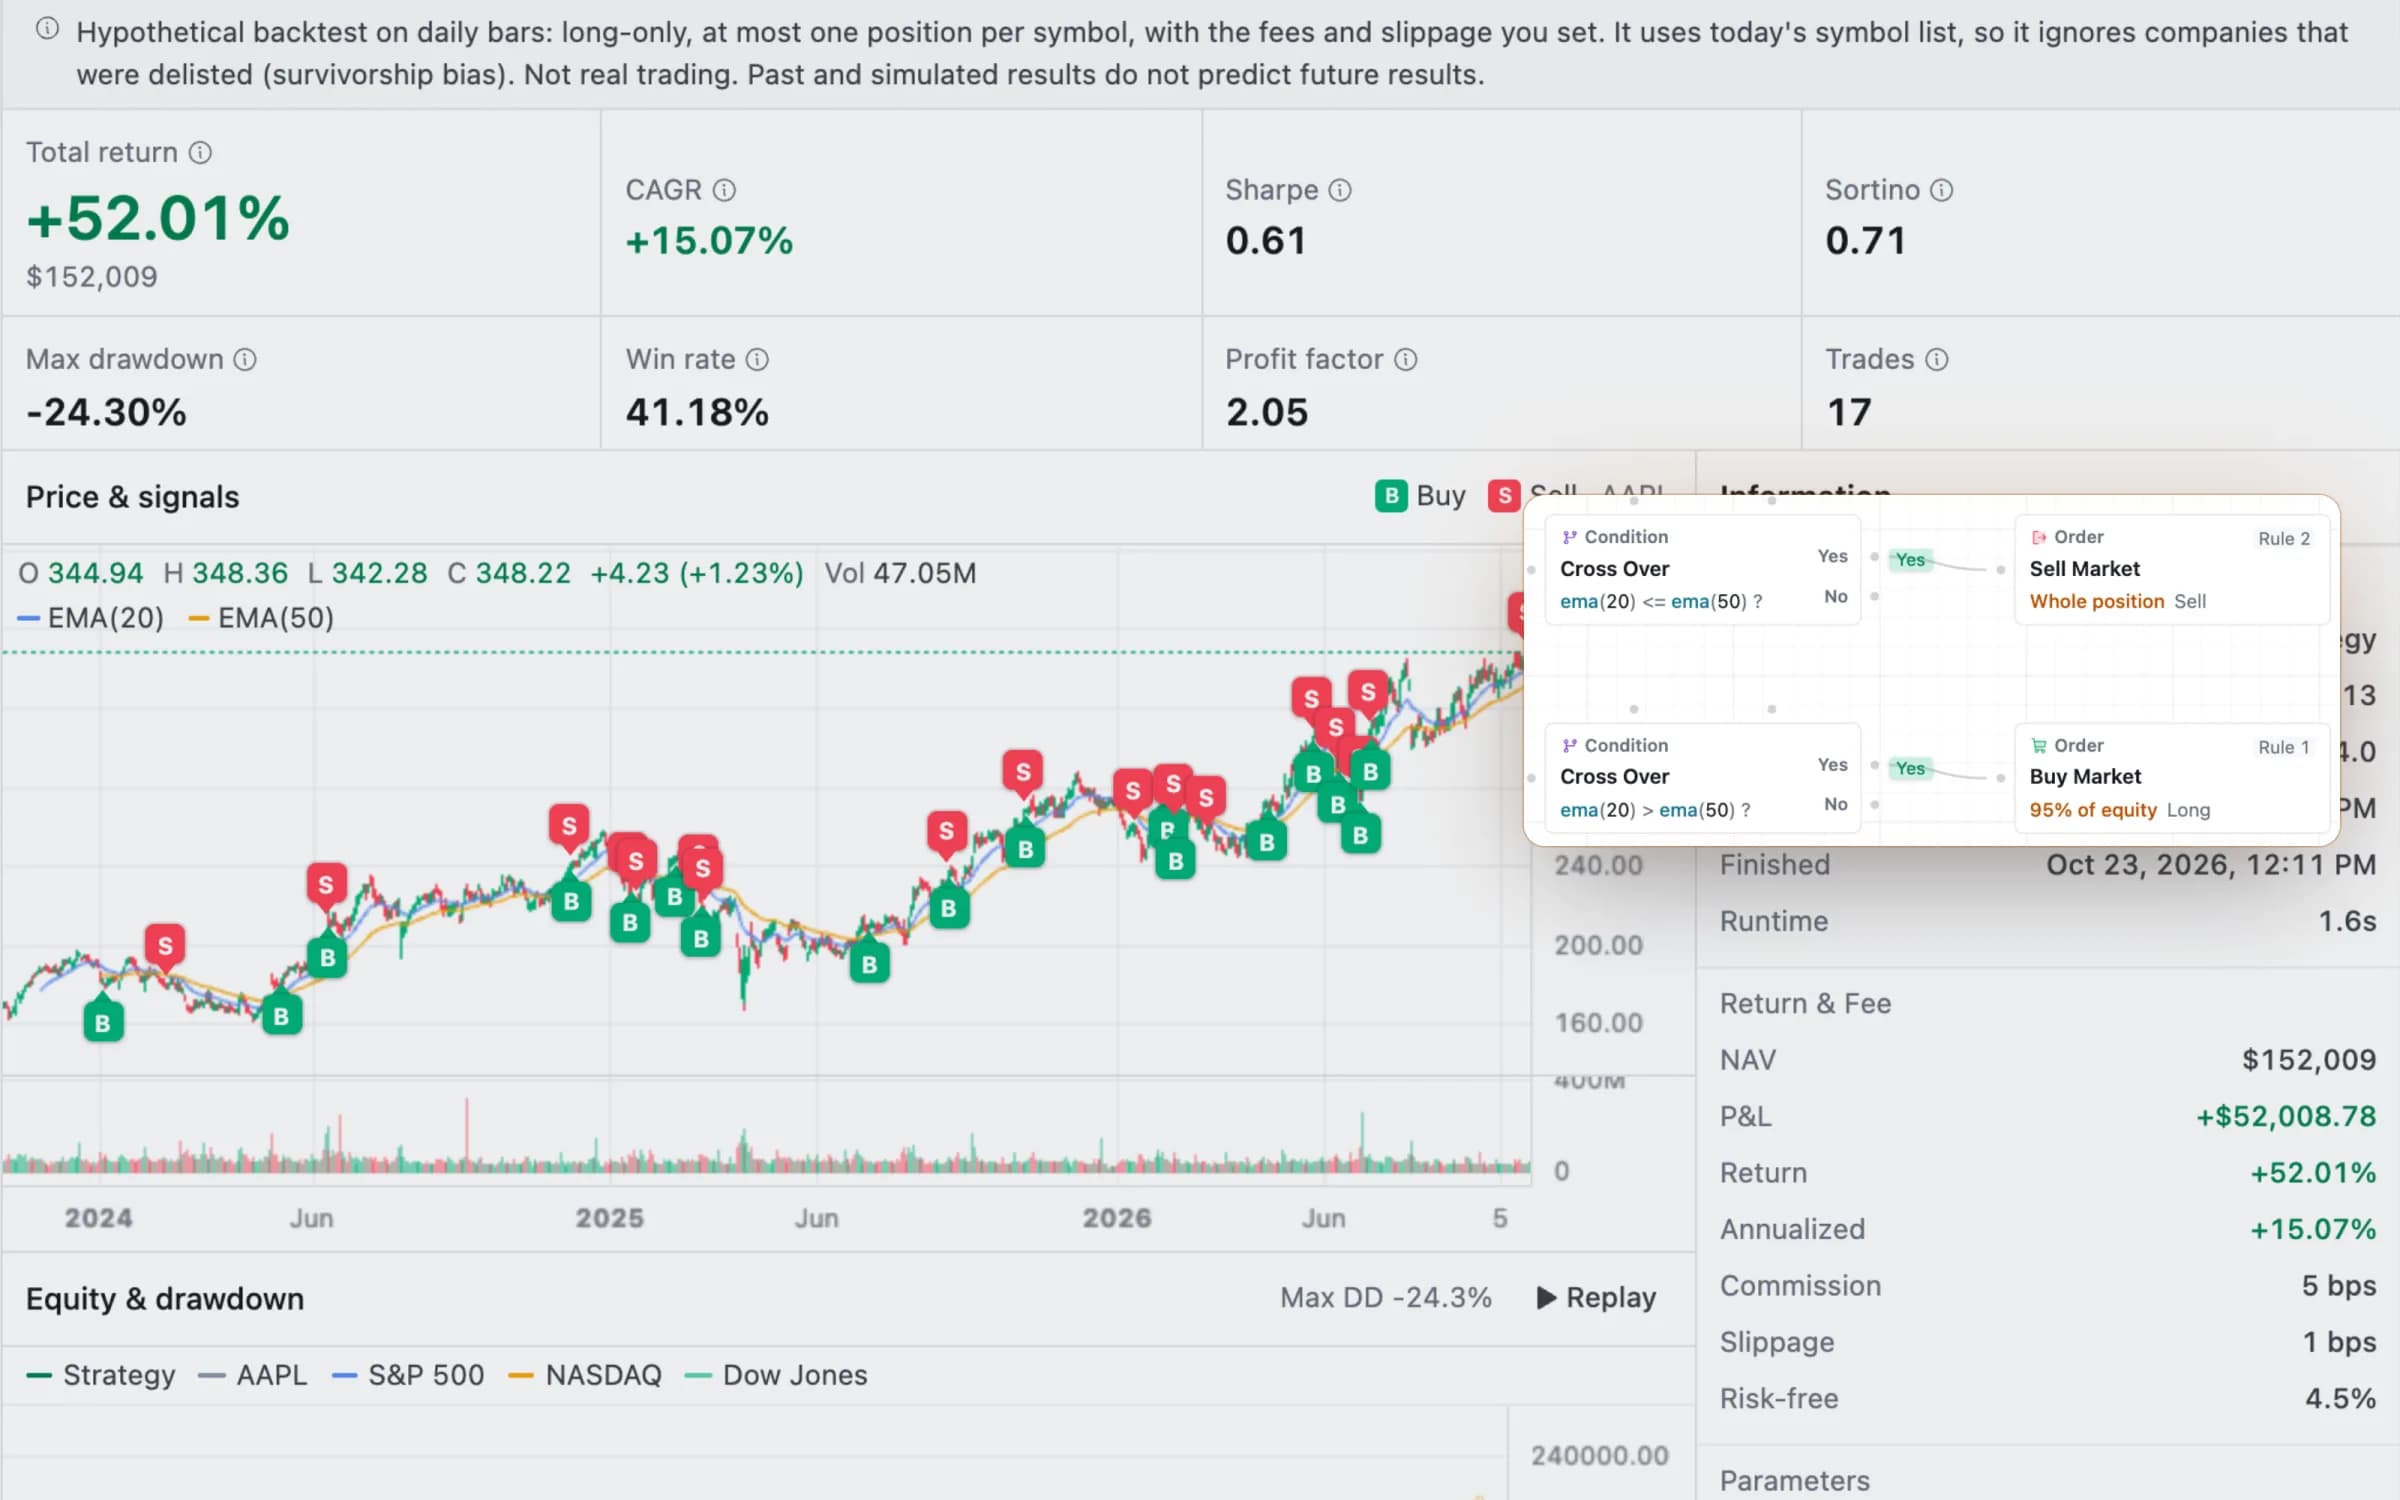
The rule a new strategy starts from, drawn on the canvas and run on real prices.
$188.49
Inside a 52-week range of $163.90 to $243.37, with the studies traders use on the same chart.
Backtest and portfolio figures are hypothetical: computed from daily closes, with no fees or taxes, and not a guide to future results.
Strategy Lab
Connect indicators, conditions and orders on a canvas, add stops and take-profits, then backtest it on historical data or run it in paper trading.
Prices come from the same plan catalog the app bills from.
Free
$0/ mo
20 AI credits a month
Pro
$24.90/ mo
500 AI credits a month
Max
$49.90/ mo
1,000 AI credits a month
Expert
$99/ mo
2,500 AI credits a month
Research markets and ask the AI Copilot. Upgrade only when you need more.
No card required.
Android app. Research and paper trading on your phone.